Performance reports
Overview
Measure your AI Agent’s performance with a variety of detailed reports. Reports help you understand conversation outcomes, identify trends, and make data-driven decisions to improve your AI Agent.
By default, reports do not include data from test users, so testing your AI Agent does not skew your results. Unless otherwise noted, you can view reports by going to Analytics > Reports in the Ada dashboard.
Use cases
Reports help you understand your AI Agent’s effectiveness and identify opportunities for improvement.
- Track automated resolution: Monitor how often your AI Agent resolves inquiries without human intervention.
- Identify knowledge gaps: Use Knowledge usage reports to find articles with low resolution rates that may need updates.
- Monitor customer satisfaction: Review CSAT scores and survey results to understand end user sentiment.
- Analyze Action performance: Track API usage, error rates, and resolution rates for each Action.
- Understand conversation patterns: Review volume, handle time, and escalation trends over time.
Capabilities & configuration
Reports provide flexible options for analyzing and exporting your AI Agent’s performance data.
- Date range filtering: View data for predefined periods or custom date ranges.
- Multi-criteria filtering: Narrow results by AR classification, CSAT, channel, language, Actions, Playbooks, Topics, and more.
- Conversation drill-through: Click metrics to view filtered conversations in the Convos view.
- Export and print: Save reports as PDF or print them for offline review.
- Test user exclusion: By default, test conversations are excluded from reports to ensure accurate metrics.
Report details
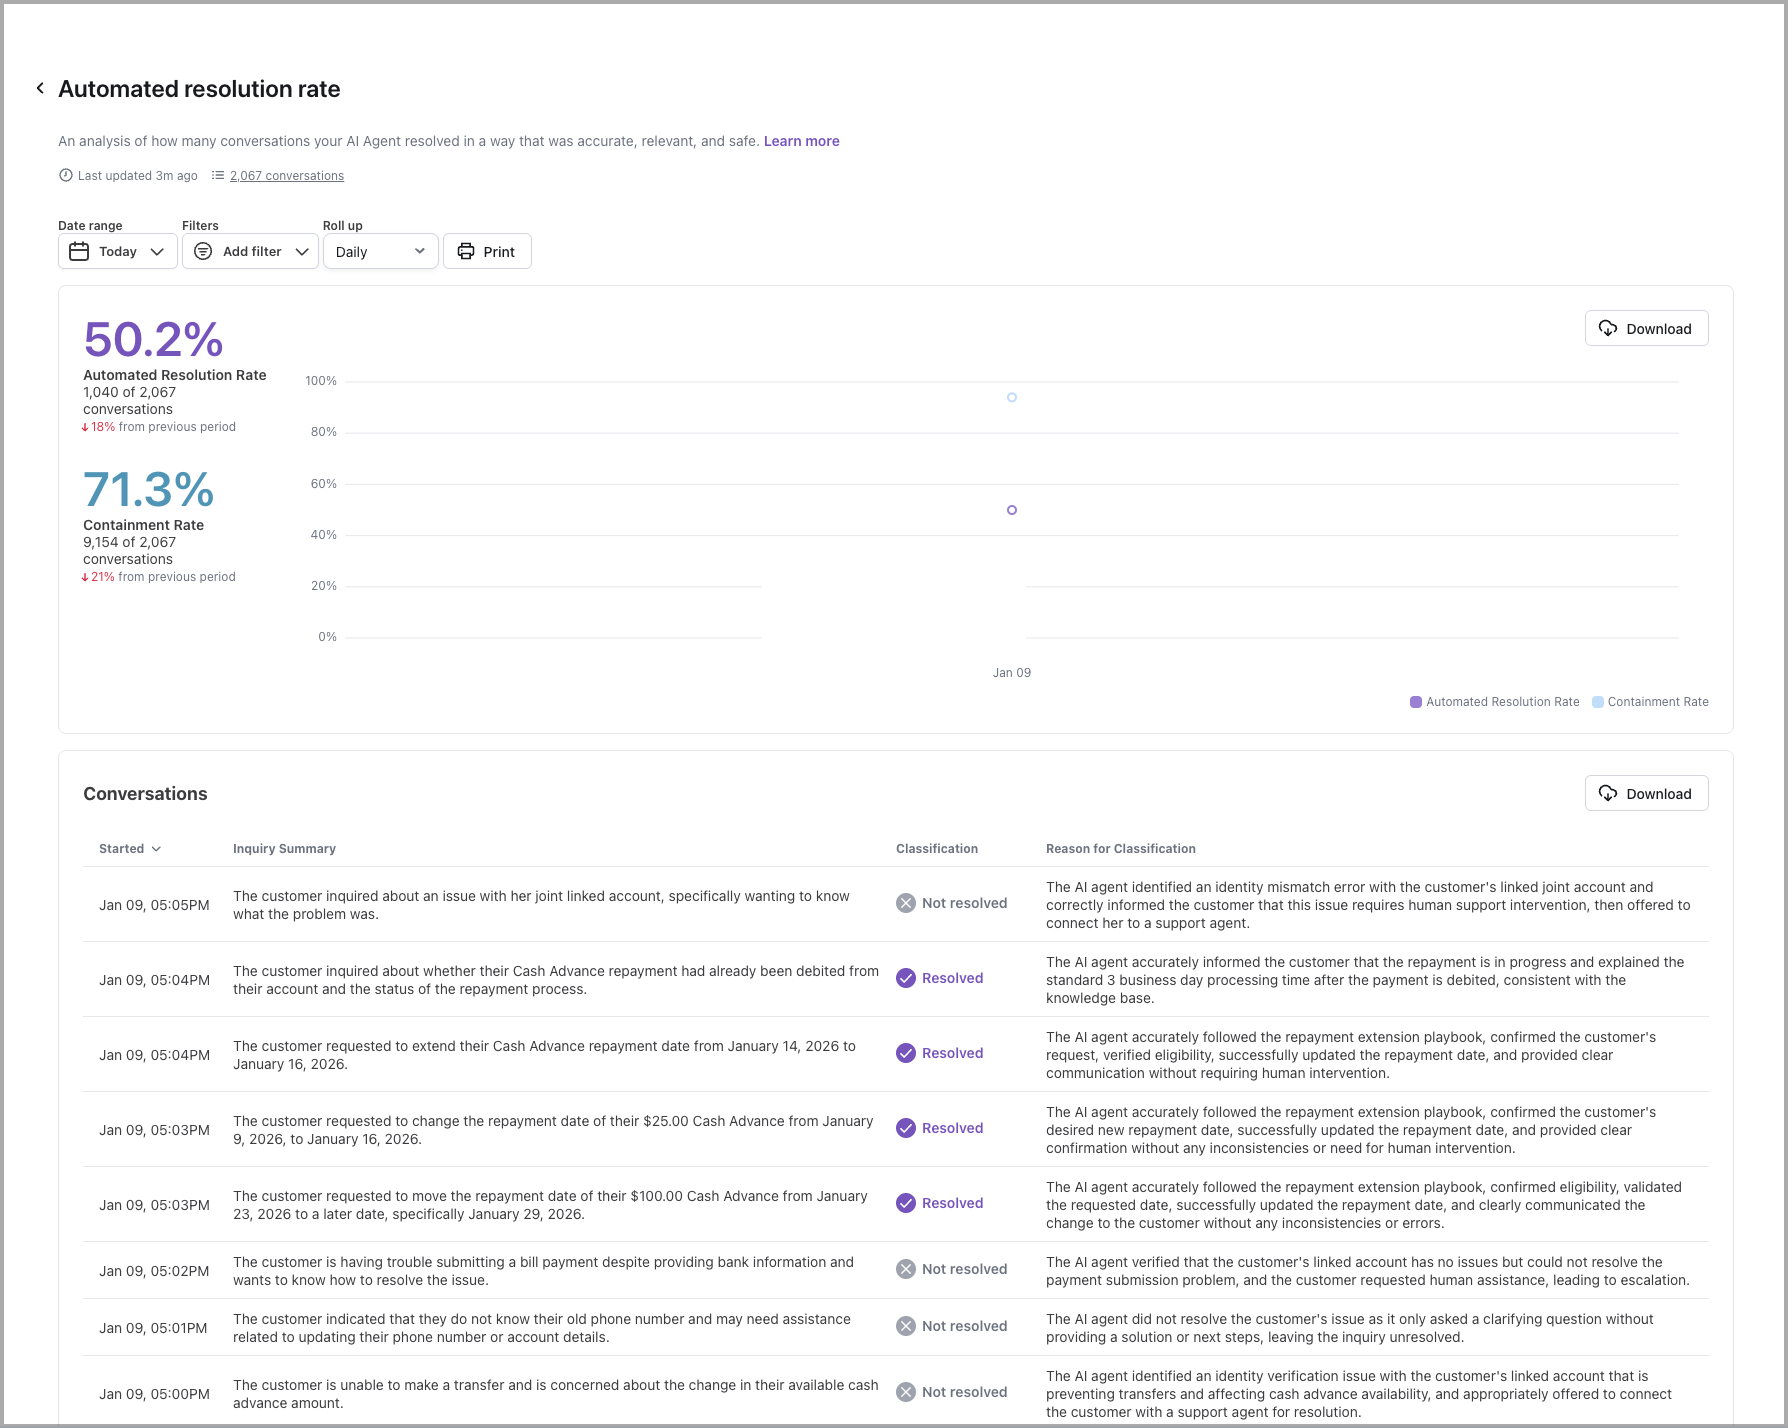
Automated resolution and containment
Learn more
The automated resolution rate is an analysis of how many conversations your AI Agent was able to resolve automatically.
To calculate the automated resolution rate, your AI Agent analyzes each completed conversation to understand both the end user’s intent and the AI Agent’s response. Based on that analysis, it then assigns a classification of either Resolved or Not Resolved to each conversation.
For a conversation to be considered automatically resolved, the conversation must be:
-
Relevant - Ada effectively understood the end user’s inquiry, and provided directly related information or assistance.
-
Accurate - Ada provided correct, up-to-date information.
-
Safe - Ada interacted with the end user in a respectful manner and avoided engaging in topics that caused danger or harm.
-
Contained - Ada addressed the end user’s inquiry without having to hand them off to a human agent.
While Containment Rate can be a useful metric to get a quick glance of the proportion of AI Agent conversations that did not escalate to a human agent, automated resolution rate takes it a step further. By measuring the success of those conversations and the content they contain, you can get a much better idea of how helpful your AI Agent really is.
Your AI Agent will only assess for automated resolution when a conversation has ended. When viewing the automated resolution rate graph, a dotted line may appear to indicate that recent conversations may not have ended and therefore may cause the automated resolution rate to fluctuate once they’re analyzed. For more information on how the conversation lifecycle impacts automated resolution, see automated resolution rate.
In this list, you can view a summary of what each end user was looking for, how your AI Agent classified the conversation, and its reasoning. If you need more information, you can click a row to view the entire conversation transcript.
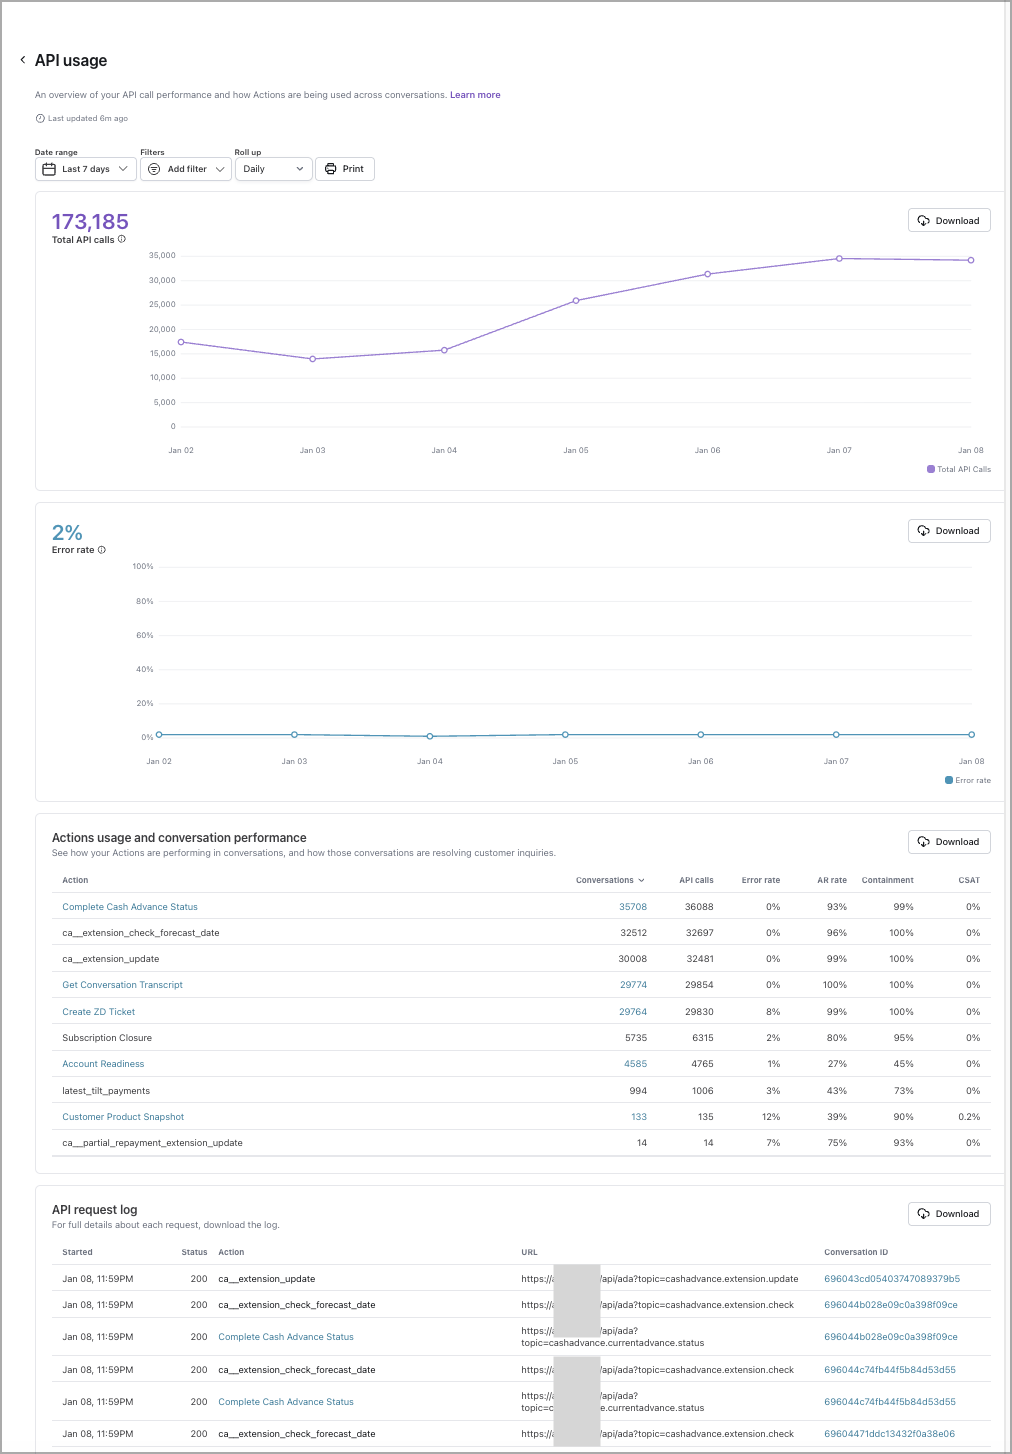
API usage
Learn more
Provides visibility into how often Ada is performing each action, and highlights errors with full log download functionality - allowing your team to troubleshoot effectively. You can access this report through the Reports tab (under Performance) in the left navigation menu or directly through the report icon at the top of the Actions Hub.
Agent satisfaction score
Learn more
View customer satisfaction (CSAT) surveys where the scores are attributed to human support, available if the “Automatically survey after chat” option is turned on.
When you filter this report by date, it uses the date that the user submitted their satisfaction survey, rather than the date the conversation started. As a result, the number of conversations that appear in this report may vary from other reports.
There are four ways you can set up customer satisfaction reviews, each with different scales for recording feedback:
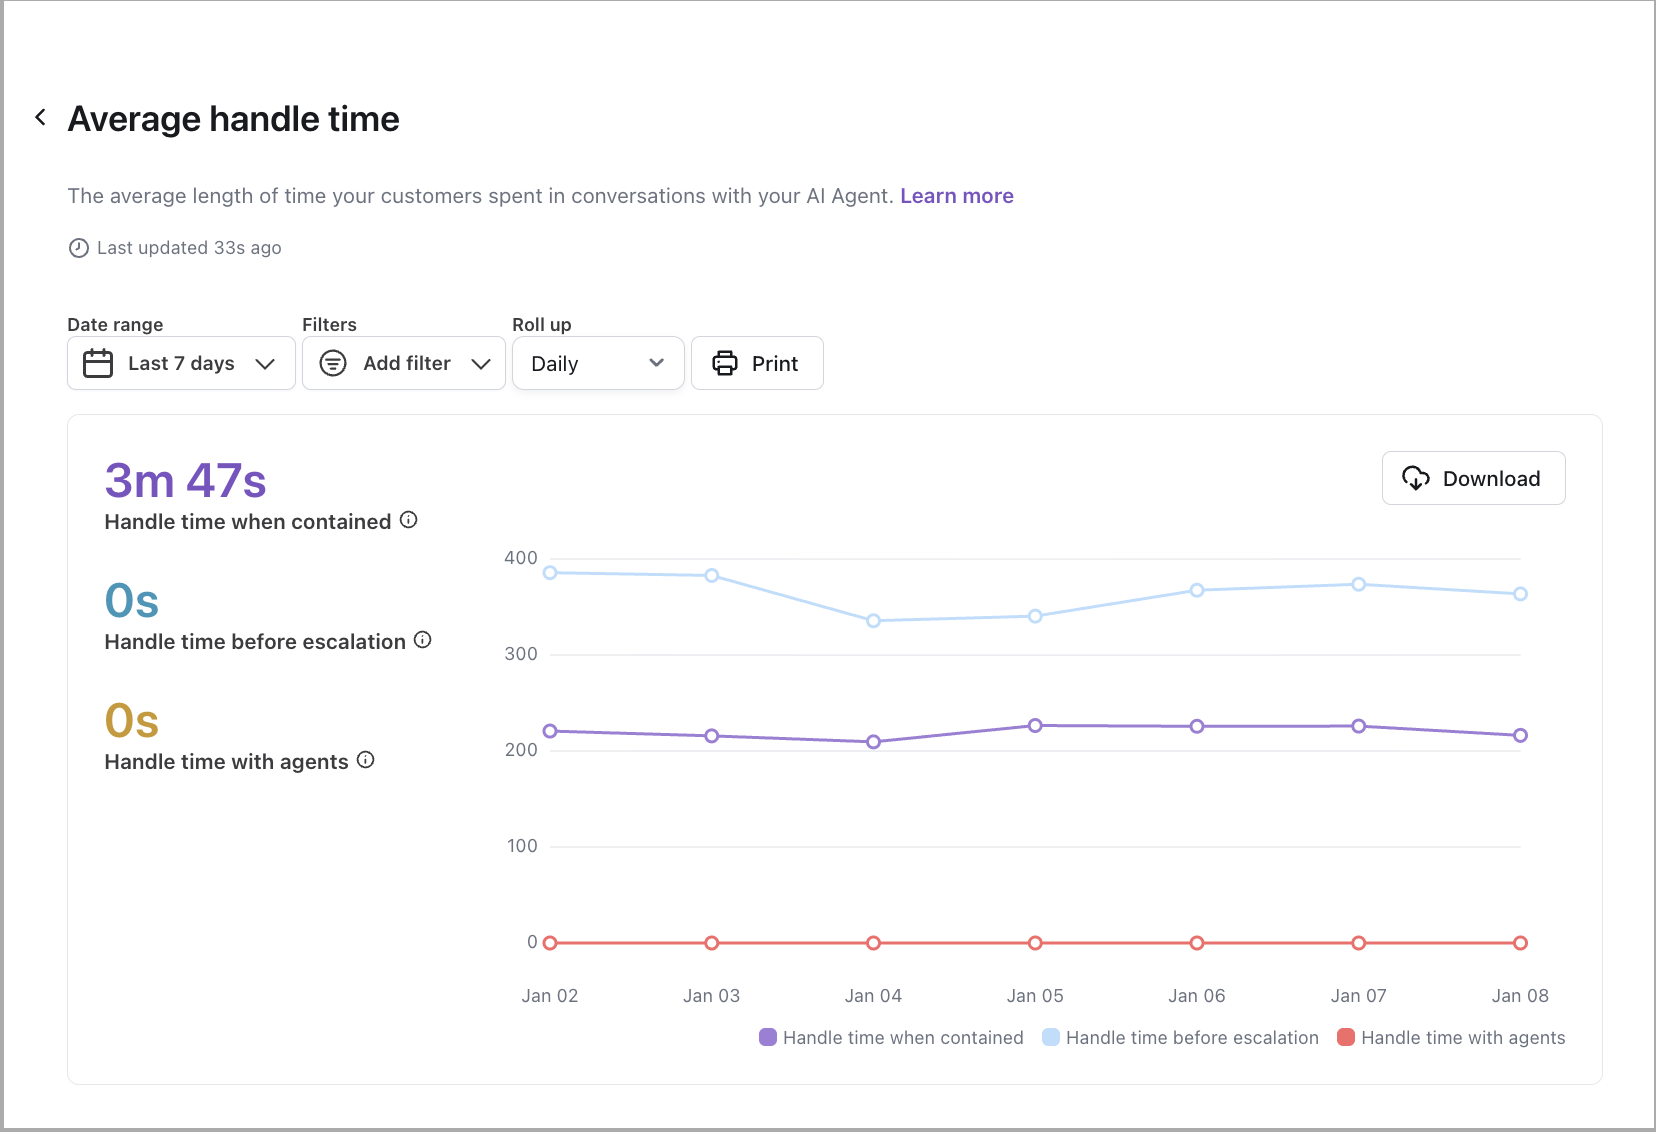
Average handle time
Learn more
View the average amount of time end users spent talking with your AI Agent, for conversations that did not end in handoffs to human support.
This report uses winsorization on all of its metrics. To handle outliers, your AI Agent calculates the 90th percentile of all handle times. If a handle time is higher than the 90th percentile limit, your AI Agent replaces it with the 90th percentile limit instead.
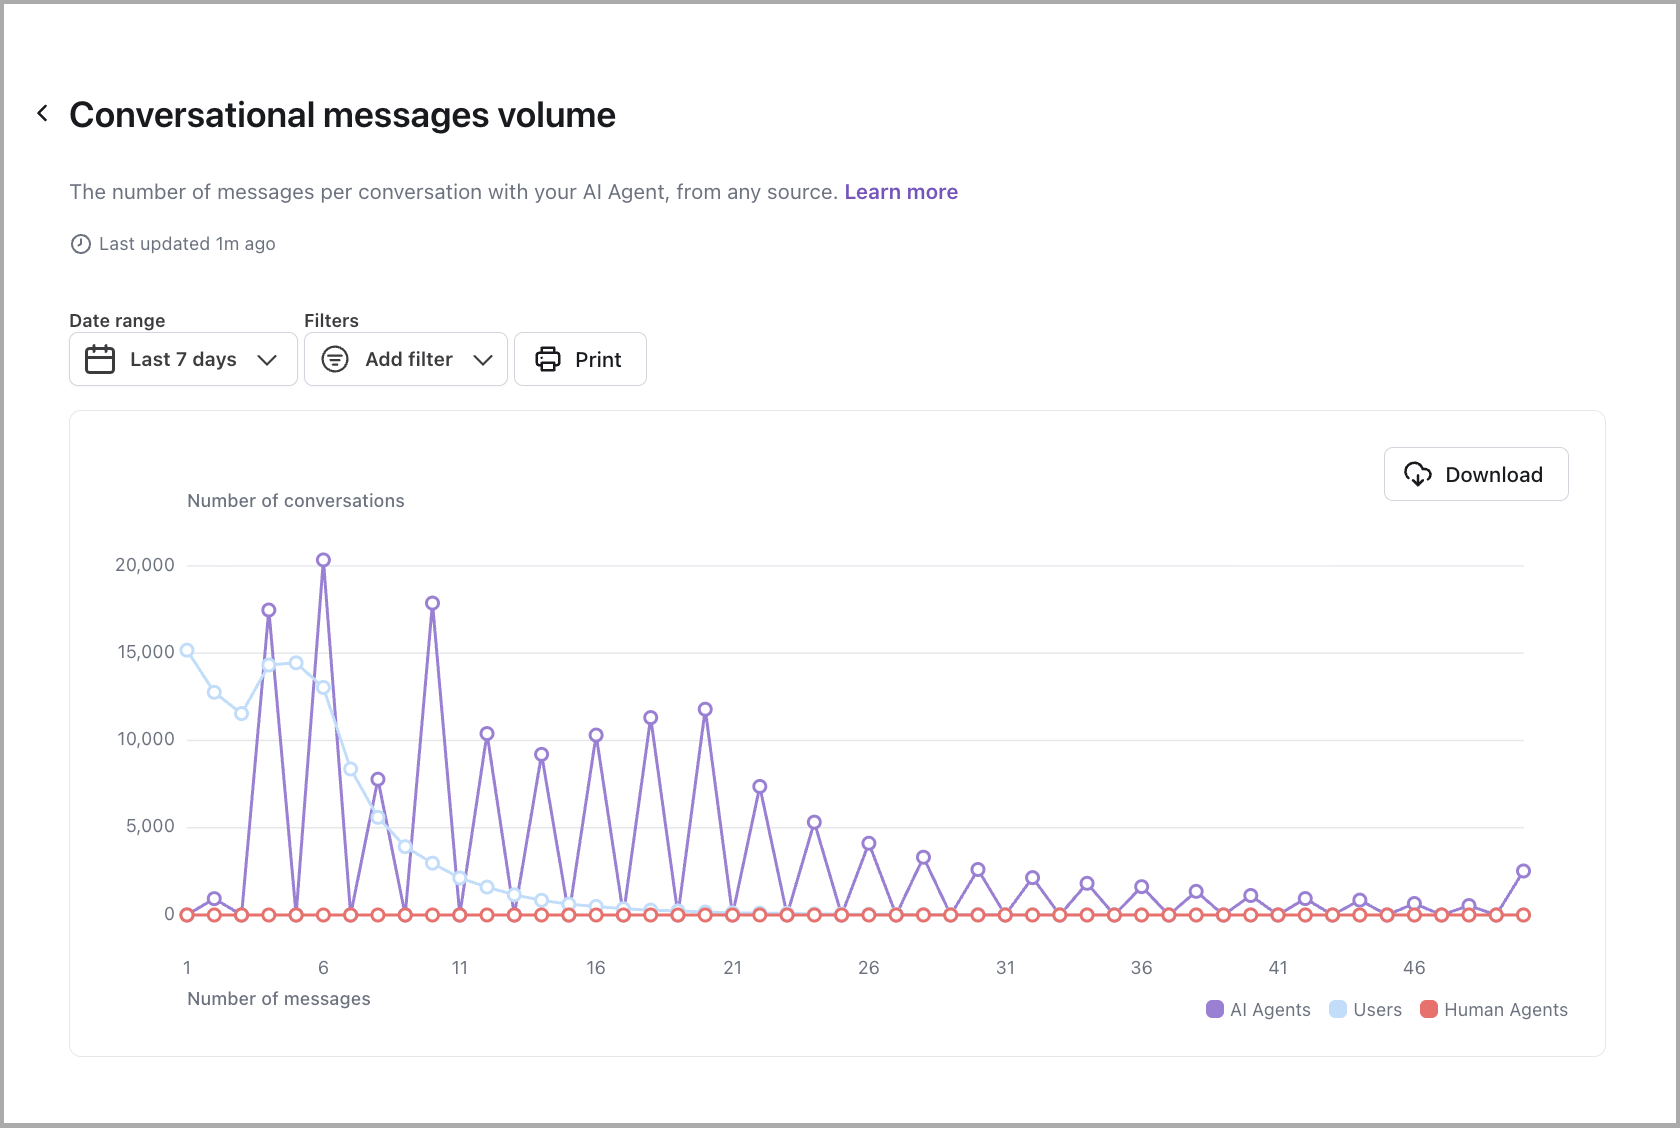
Conversational messages volume
Learn more
View the number of AI Agent, end user, and human agent messages per conversation.
Example conversation:
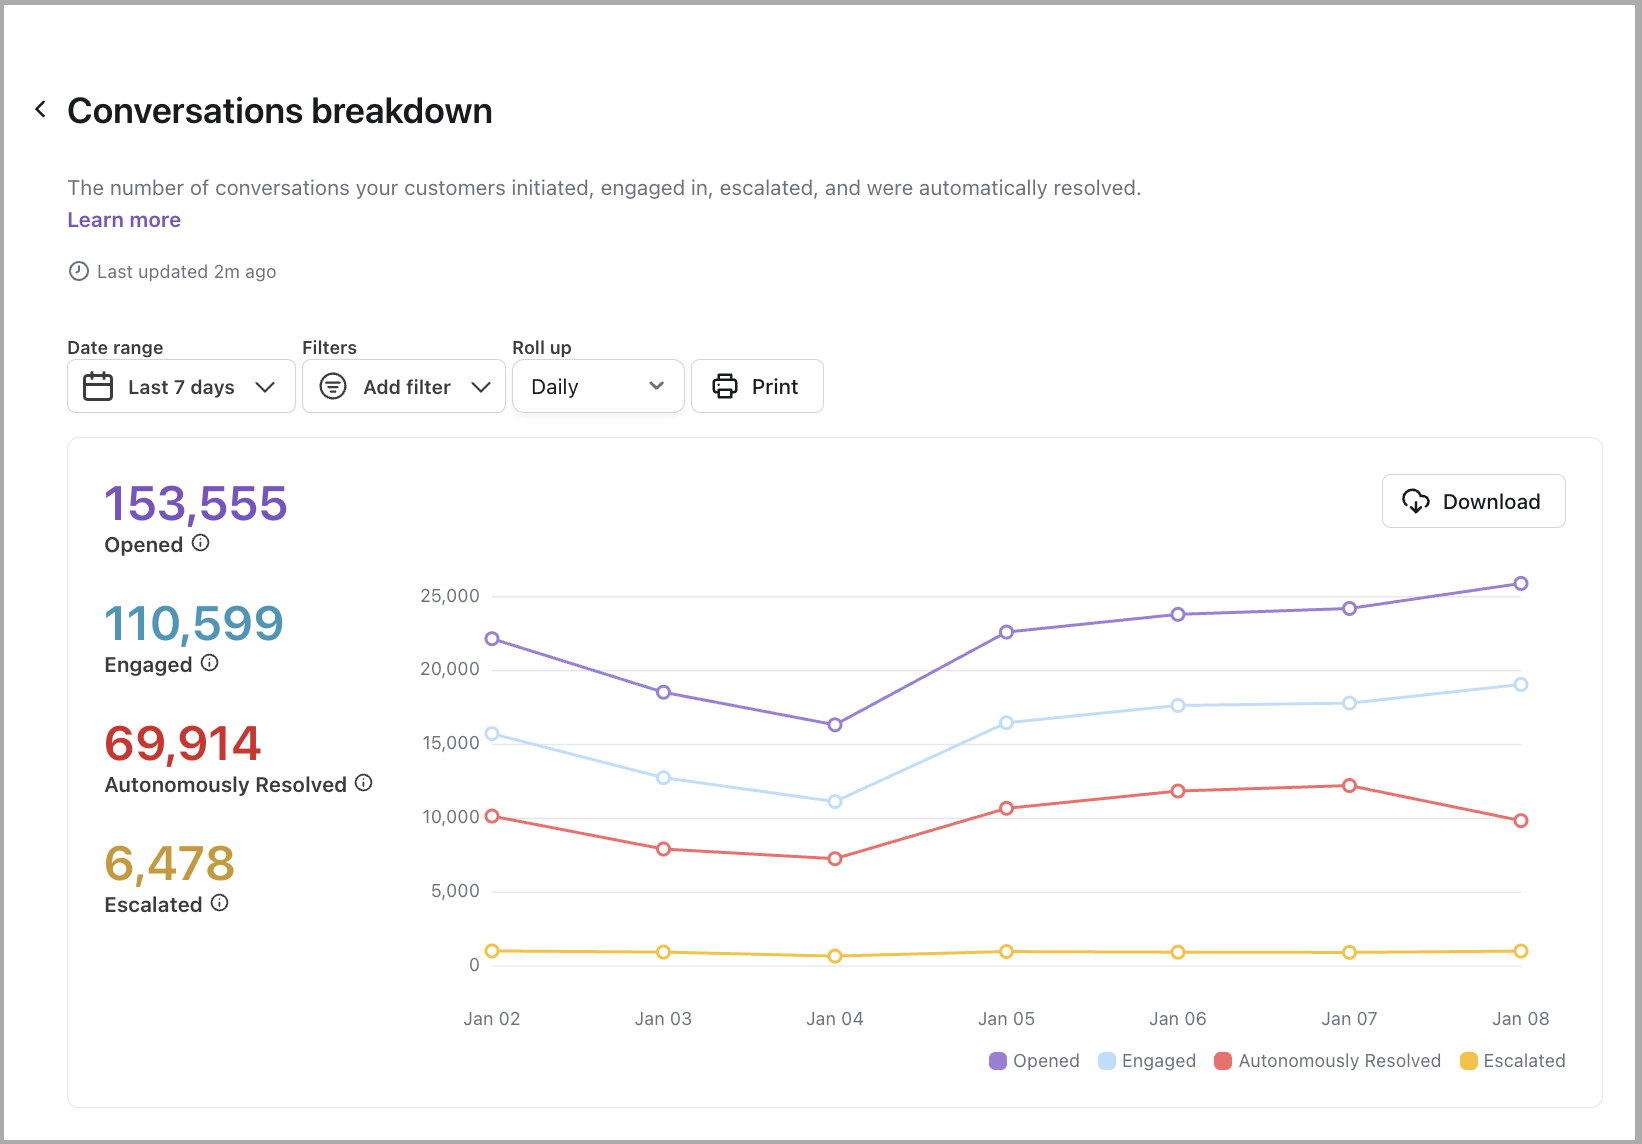
Conversations breakdown
Learn more
View the number of conversations initiated, engaged, and escalated in your AI Agent.
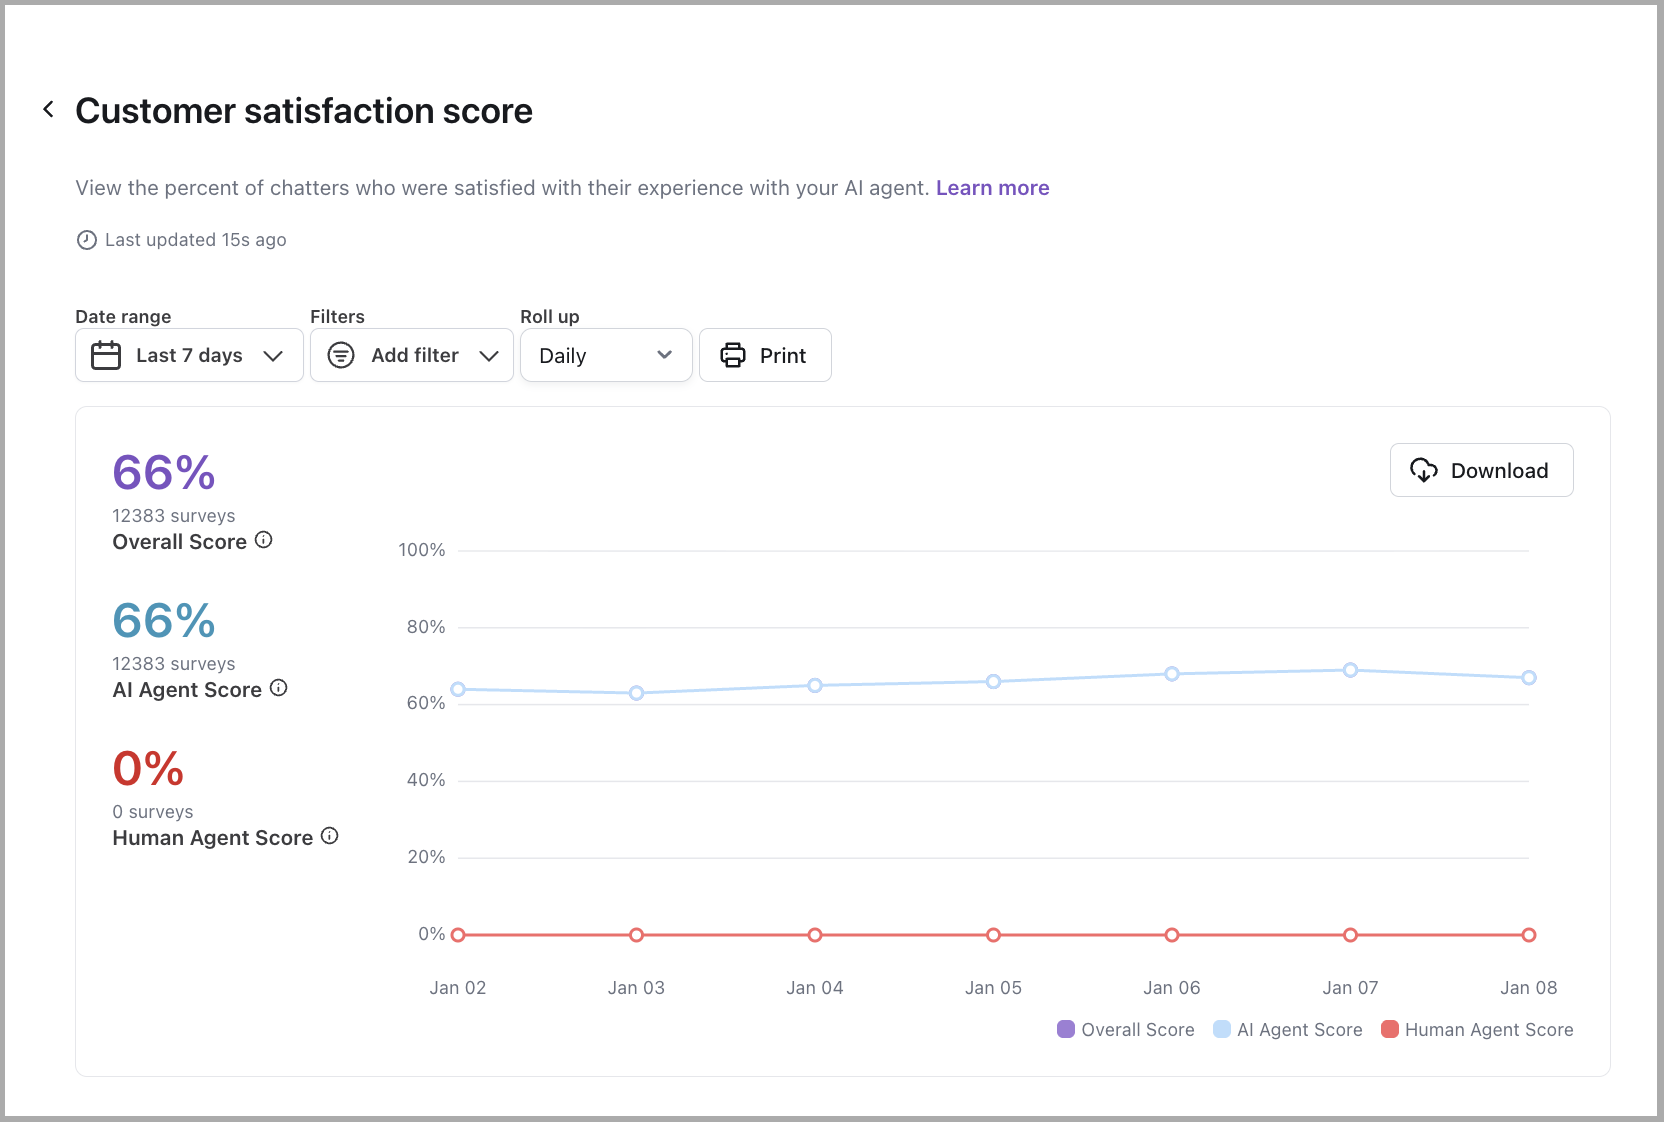
Customer satisfaction score
Learn more
View the percent of your AI Agent’s conversations that end users reviewed positively. For more information, see Collect and analyze customer satisfaction data with Satisfaction Surveys.
There are four ways you can set up customer satisfaction reviews, each with different scales for recording feedback:
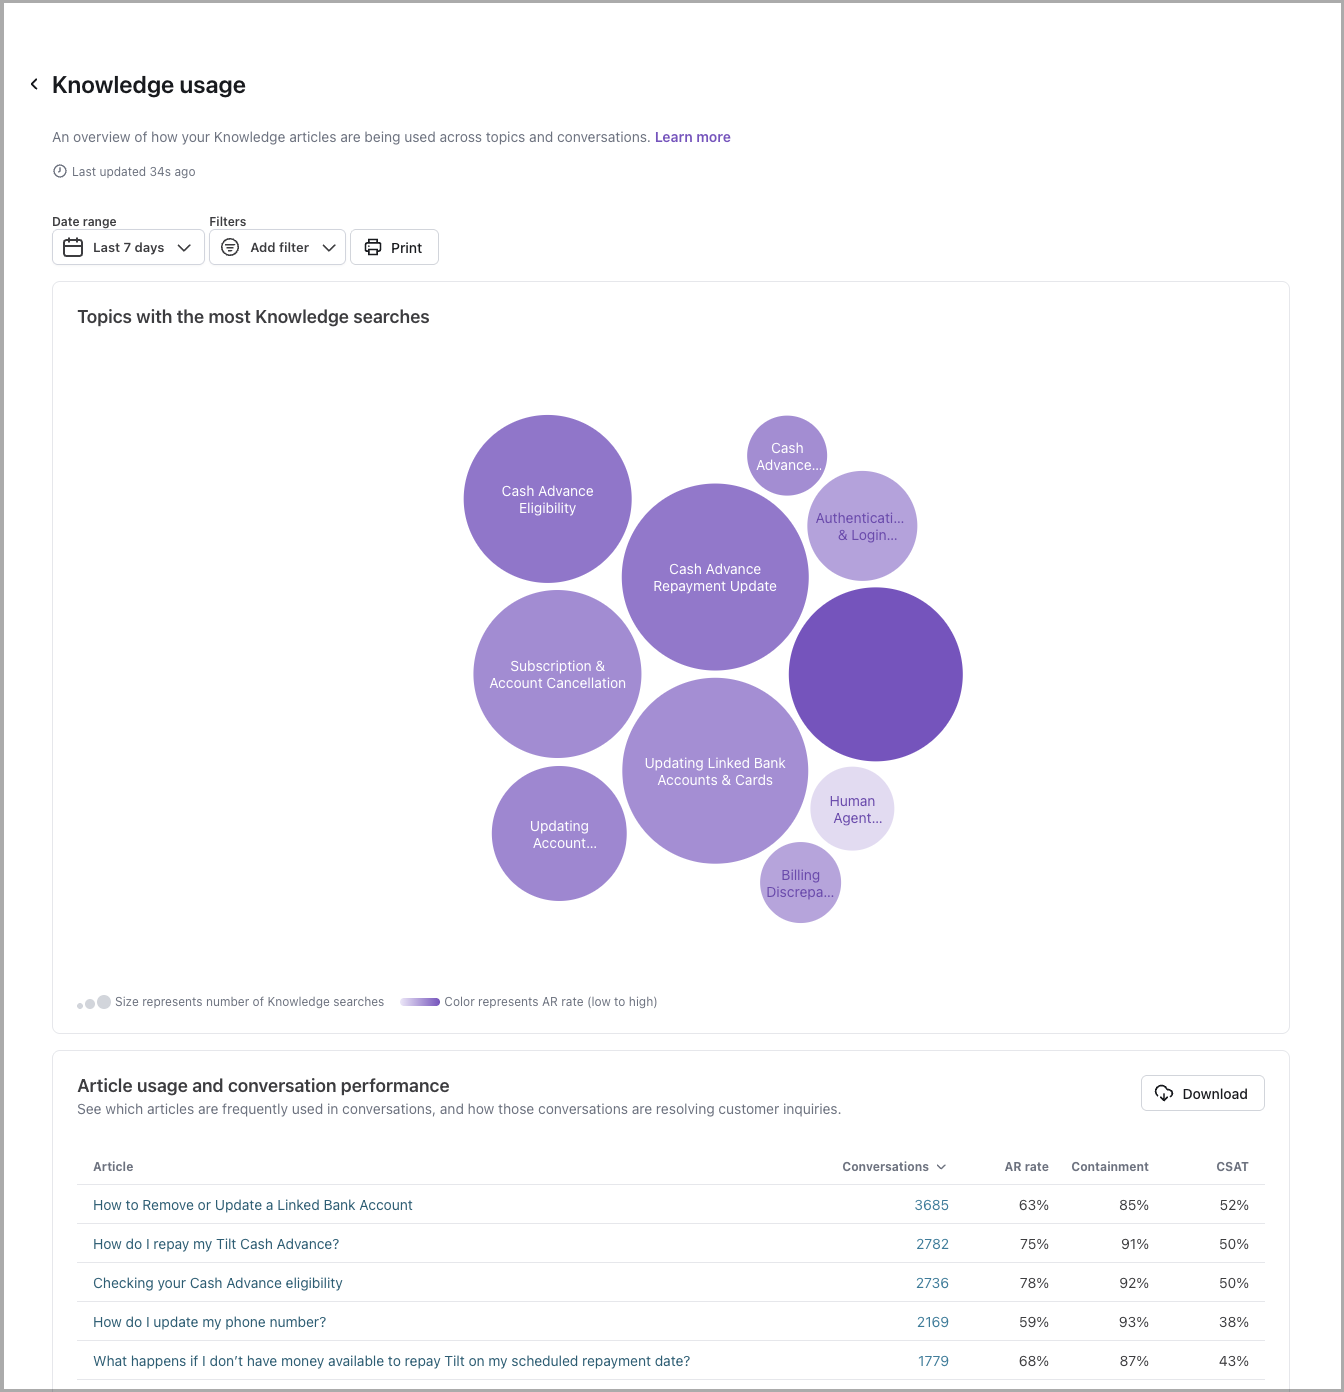
Knowledge usage
Learn more
View to help you understand which articles are most frequently used by Ada in end user responses, and which articles are correlated with high or low Automated Resolution Rates as well as other performance metrics. Includes conversation drill-throughs to support improvement workflows. You can access this report through the Reports tab (under Performance) in the left navigation menu or directly through the report icon at the top of the Knowledge Hub.
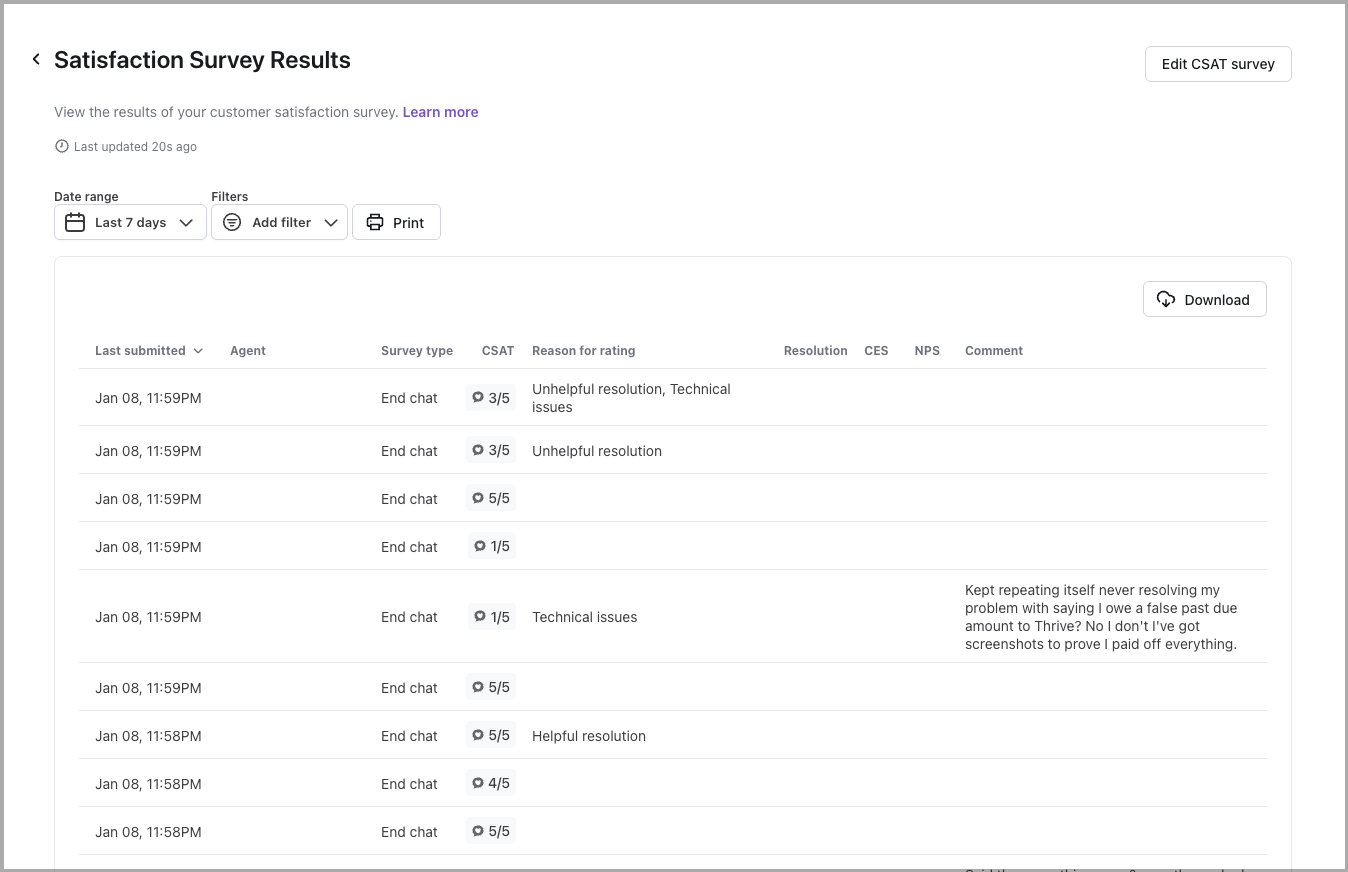
Satisfaction survey results
Learn more
View the results of your customer satisfaction (CSAT) survey. For more information, see Collect and analyze customer satisfaction data with Satisfaction Surveys.
When you filter this report by date, it uses the date that the user submitted their satisfaction survey, rather than the date the conversation started. As a result, the number of conversations that appear in this report may vary from other reports.
There are four ways you can set up customer satisfaction reviews, each with different scales for recording feedback:
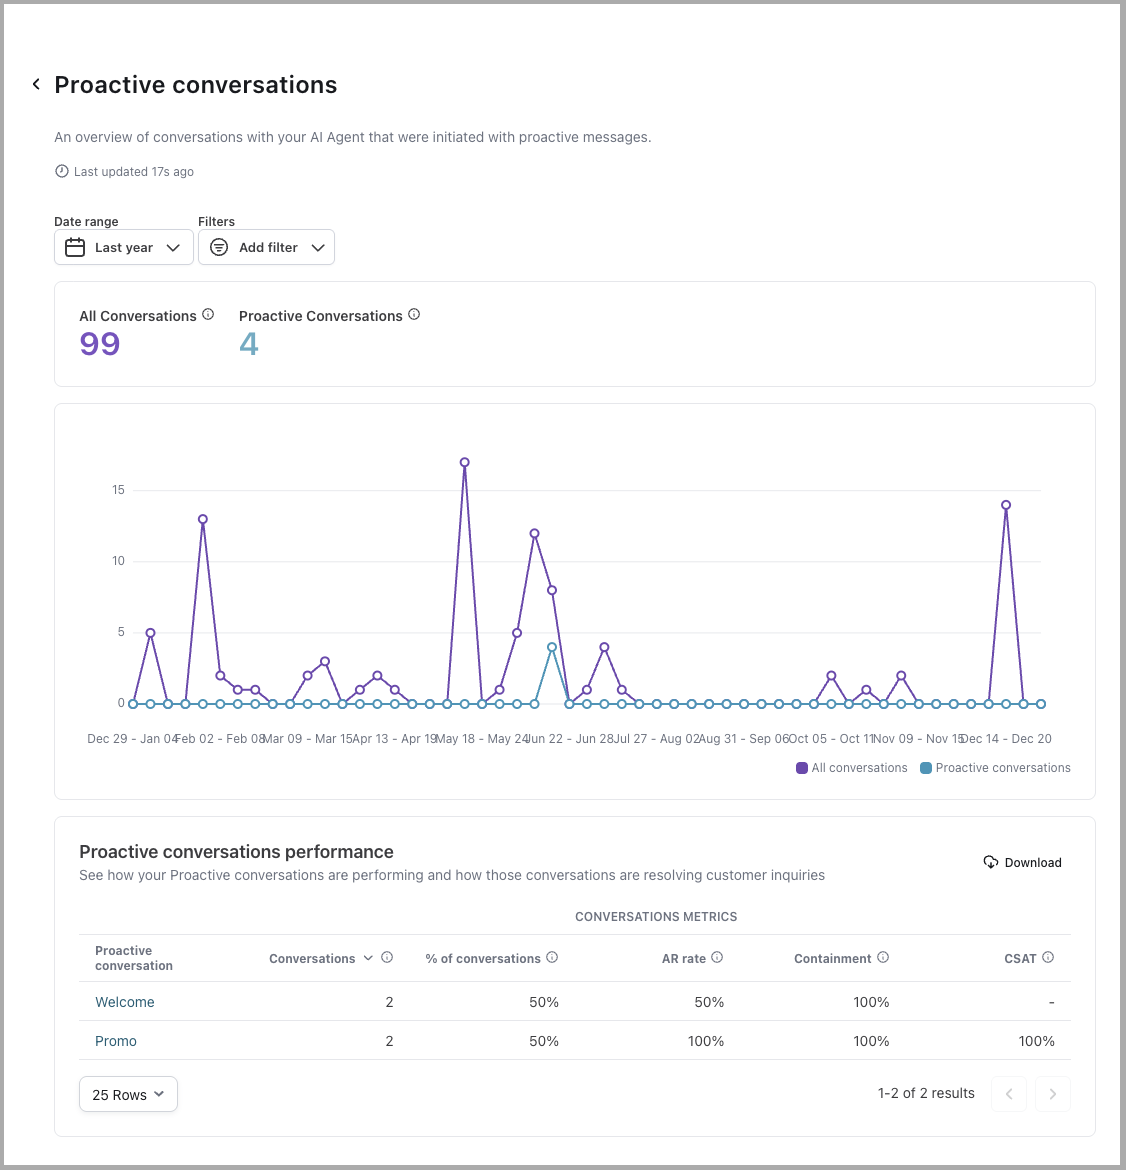
Proactive conversations
Learn more
View a detailed breakdown of how your AI Agent is engaging end users through Proactive conversations and how effectively those interactions contribute to automated resolutions and customer satisfaction.
At the top of the report, you’ll see a graph that compares:
- All Conversations: The total number of conversations that occurred within the selected date range.
- Proactive Conversations: The number of conversations initiated by your AI Agent through Proactive messages that received at least one end user response.
This graph allows you to understand the reach and uptake of Proactive messaging in the context of your broader end user engagement volume. By comparing trends in Proactive conversations to overall volume, you can assess how actively end users are engaging with proactive outreach efforts and identify opportunities to refine your messaging strategy.
Beneath the graph, a table gives you a detailed breakdown of how each individual Proactive conversation is performing. Each row represents a specific Proactive conversation, with the following metrics displayed:
Quick start
View and filter report data in a few steps.
For detailed filtering options, see Implementation & usage.
Implementation & usage
Filter and export report data to focus on the metrics that matter most to your analysis.
Filter by date
To filter a report by date:
-
Click the date filter drop-down.
-
Define your date range by one of the following:
-
Select a predefined range from the list on the left.
-
Type the filter start date in the Starting field. Type the filter end date in the Ending field.
-
Click the starting date on the calendar on the left, and the ending date on the calendar on the right.
-
-
Click Apply.
The date filter dropdown provides you with the ability to specify the date range you want to filter the report’s data by. You can select from a list of preset date ranges or select Custom… to specify your own by way of a calendar selector.
Filter by additional criteria
The list of available filters differs for each report, depending on the data the report includes. Clicking the Add Filter drop-down menu gives you access to the filters relevant to the report you’re viewing.
Use these options to control which data appears in a report.
-
Include test user: Include data from conversations originating from the Ada dashboard test AI Agent. Test conversations are excluded by default.
-
AR classification: The automatic resolution classification for the conversation.
-
Coaching: Conversations where one or more Coaching instructions were applied.
-
CSAT: Customer satisfaction (CSAT) ratings submitted by end users.
-
Article: Conversations that referenced one or more specific Knowledge articles.
-
Action: Conversations associated with one or more Actions.
-
Playbook: Conversations associated with one or more Playbooks.
-
Generated topic: Conversations your AI Agent automatically assigned to one or more Topics.
-
Engaged: Conversations where an end user sent at least one message.
-
Handoff: Conversations that resulted in a Handoff to a human agent.
-
Language (Multilingual feature required): View reporting analytics that referenced conversations in one or more specific Languages.
-
Channel: The Channel where the conversation took place. For example, Ada Web Chat, SMS, WhatsApp, and so on.
-
Browser: Conversations where end users used specific browsers. For example, Chrome, Firefox, Safari, and so on.
-
Device: Conversations where end users used a specific device or operating system. For example, Windows, iPhone, Android, and so on.
-
Live agent: Conversations that involved one or more human agents.
-
Status code: Conversations that include API calls that resulted with one or more specific error code types. For example, 1xx, 2xx, 3xx, and so on.
-
Agent review: Conversations that include a human agent’s review.
-
Reason for rating: Conversations where end users selected one or more specific reasons when submitting a CSAT rating.
-
Variable: Conversations that include one or more Variables. You can filter by specific values or by whether a Variable Is Set or Is Not Set.
Additional information
-
Report data is updated approximately every hour (but may take up to three hours).
-
Reports are in the time zone set in your profile.
Print a report
For the best experience, view reports directly in the dashboard. If you need to save a report as a PDF or print it, use these settings to limit rendering issues.
To print or save a report as PDF:
-
Click Print.
-
In the Print window that appears, beside Destination, select either Save as PDF or a printer.
-
Click More settings to display additional print settings.
-
Set Margins to Minimum.
-
Set Scale to Custom, then change the value to 70.
- Alternatively, you can set the Paper size to A3 (11-3/4 x 16-1/2 in) or Legal (8.5 x 14 in).
-
Under Options, select the Background graphics check box.
-
Right before saving or printing, scroll through your print preview, and beside Pages, change the number of pages you want to include in your PDF or printout. The settings you changed above may affect how these pages render.
-
If your destination is Save as PDF, click Save. If your destination is a printer, click Print.
Related features
Explore additional analytics and optimization options.
- Topics & Intents: Analyze conversation trends by Topic and Intent.
- Conversations: View individual conversations from report metrics.
- CSAT: Configure customer satisfaction surveys.
- Knowledge: Manage articles used by your AI Agent.
- Actions: Create and monitor API integrations.
- Coaching: Improve AI Agent responses based on report insights.