View detailed reports on your bot's performance
Overview
There is a variety of detailed reports you can use to measure your bot’s performance. This article outlines the individual reports, what they measure, and how the various filters work. Unless otherwise noted, you can view these reports by going to Measure > Reports in your Ada dashboard.
Generally, these reports don’t include data from test users. That means that when you’re testing your bot, you don’t have to worry about skewing your report results. The exception to this, as noted below, is SMS campaigns, because there’s no way to mark SMS message recipients as test users.
Learn about each report
Click a report name below to expand it and learn about the metrics it includes. Note that the reports that are available in your bot will vary based on your Ada subscription. If you have any questions, don’t hesitate to contact your Ada team.
For more information on the filters you can use to refine your report data, see the Filter the data that appears in a report section of this page.
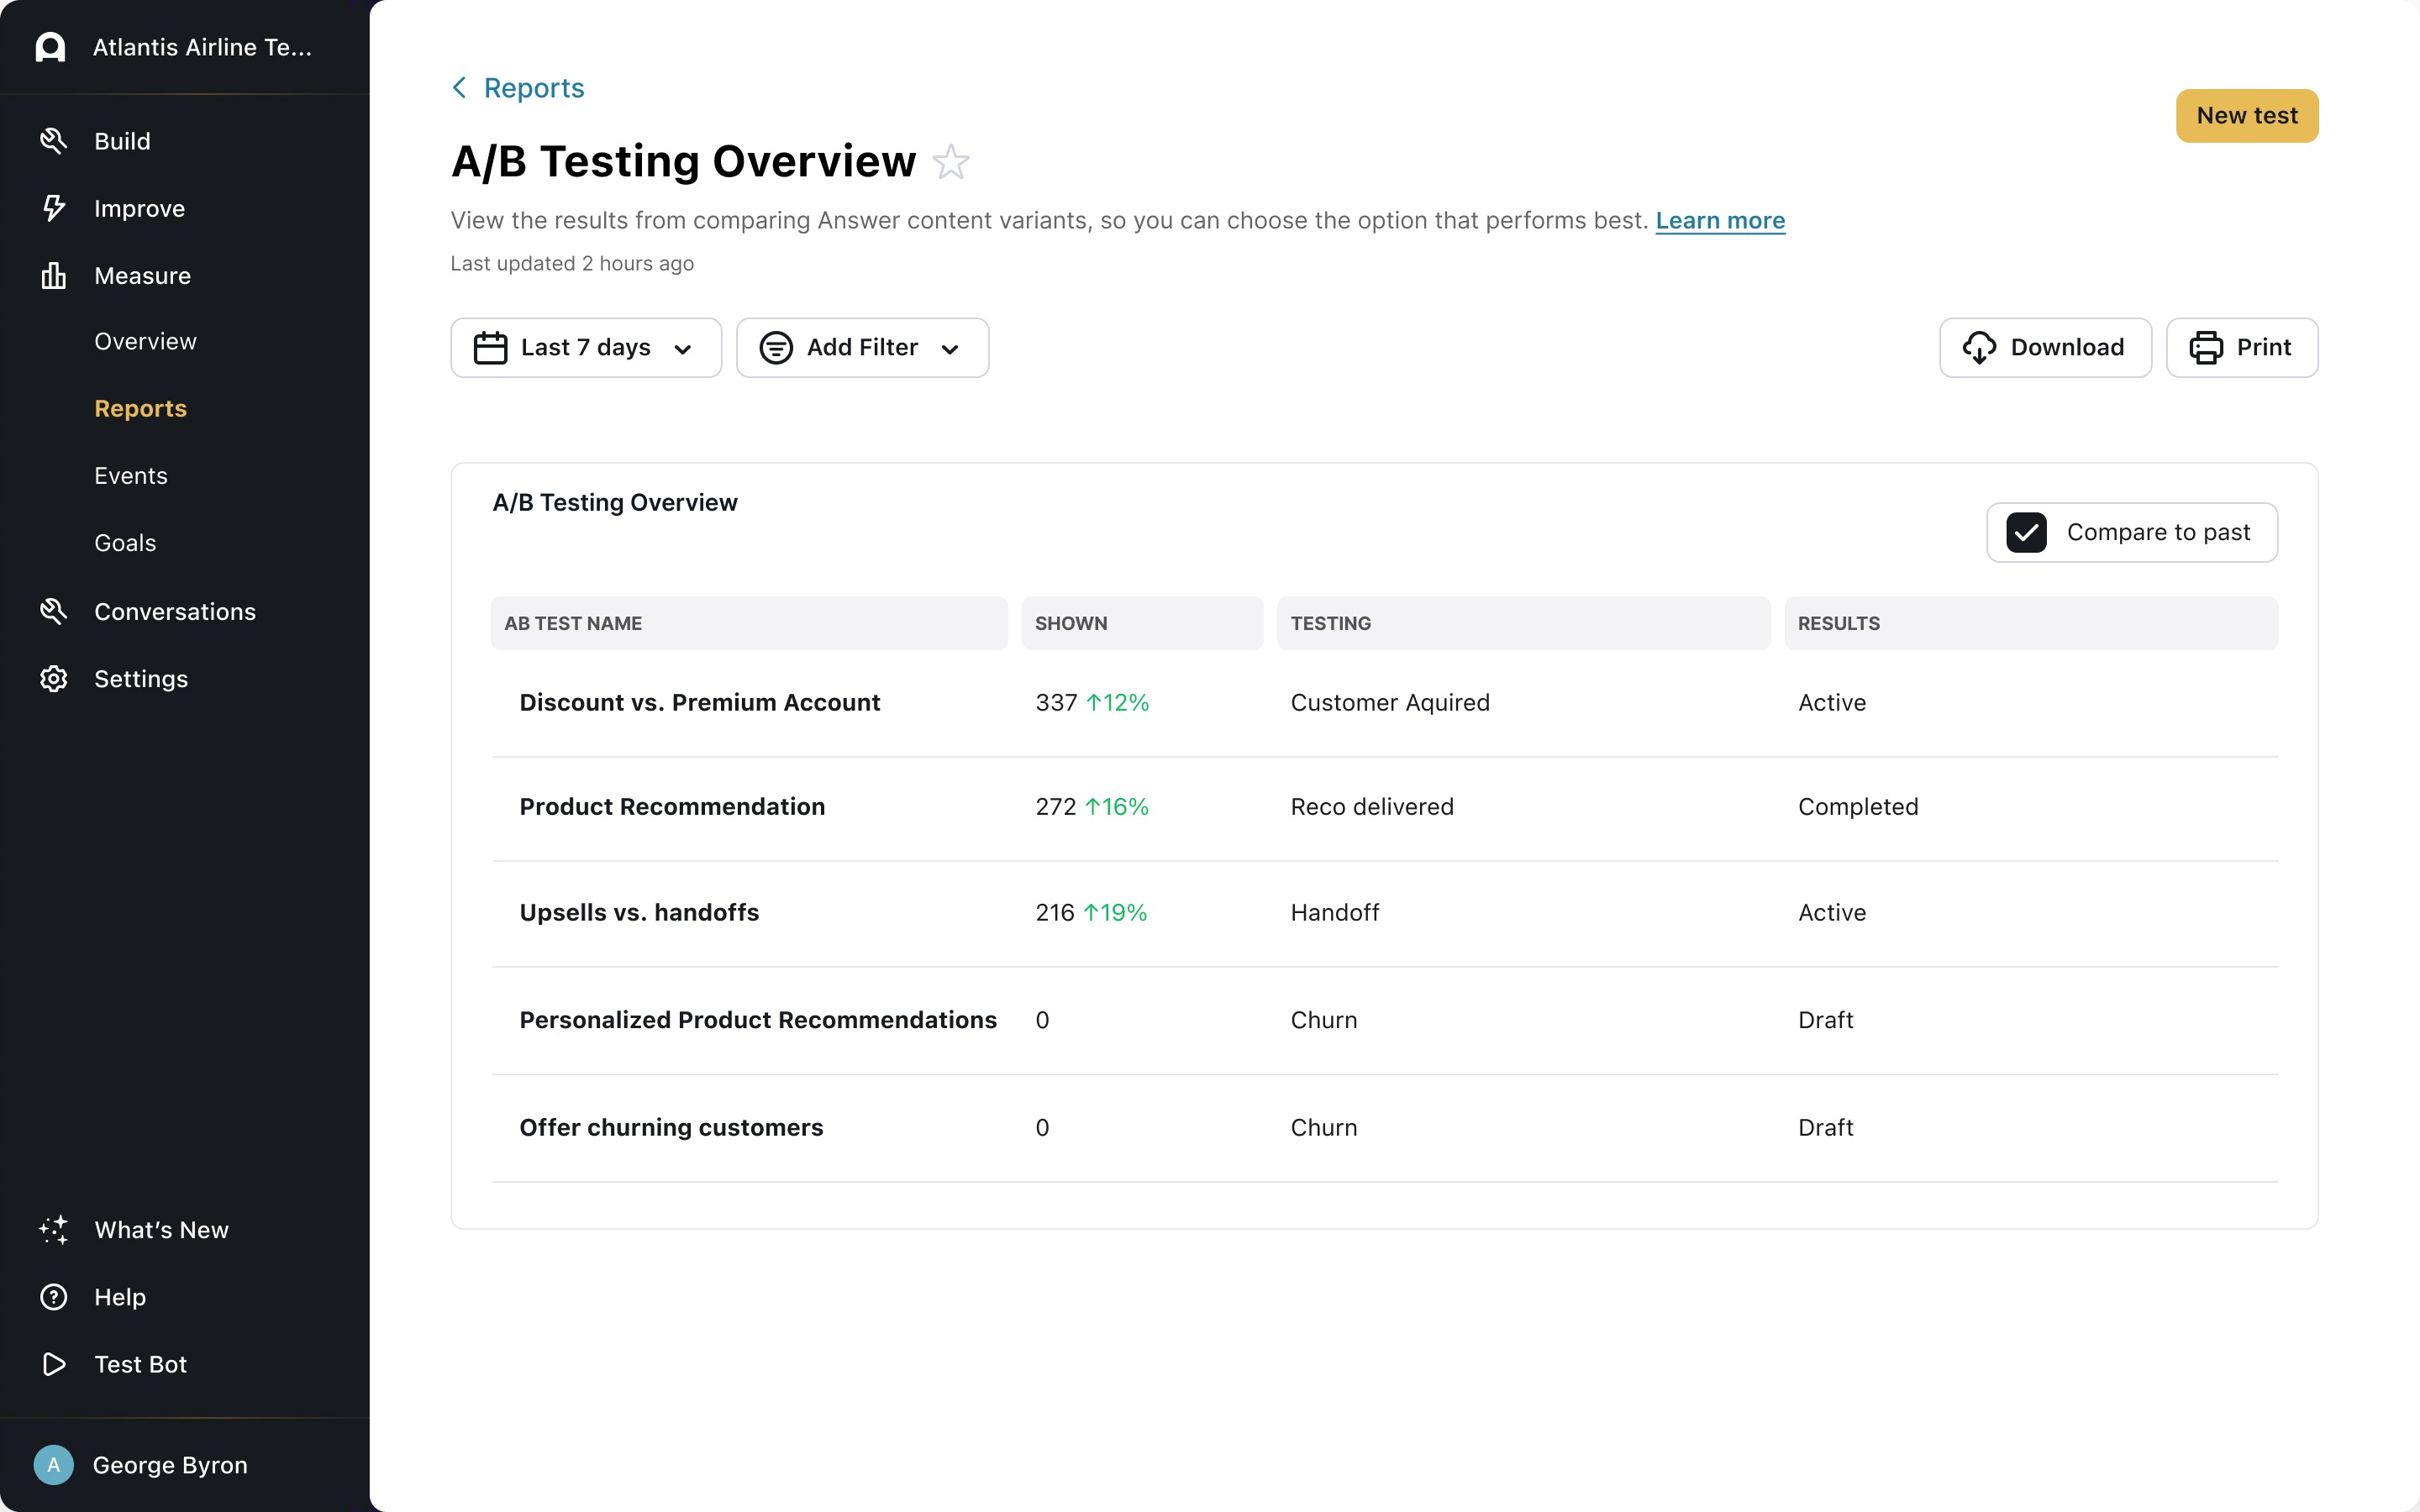
A/B Testing Overview
View the results from comparing Answer content variants, so you can choose the option that performs best. For more information on A/B testing, see Run an A/B test.
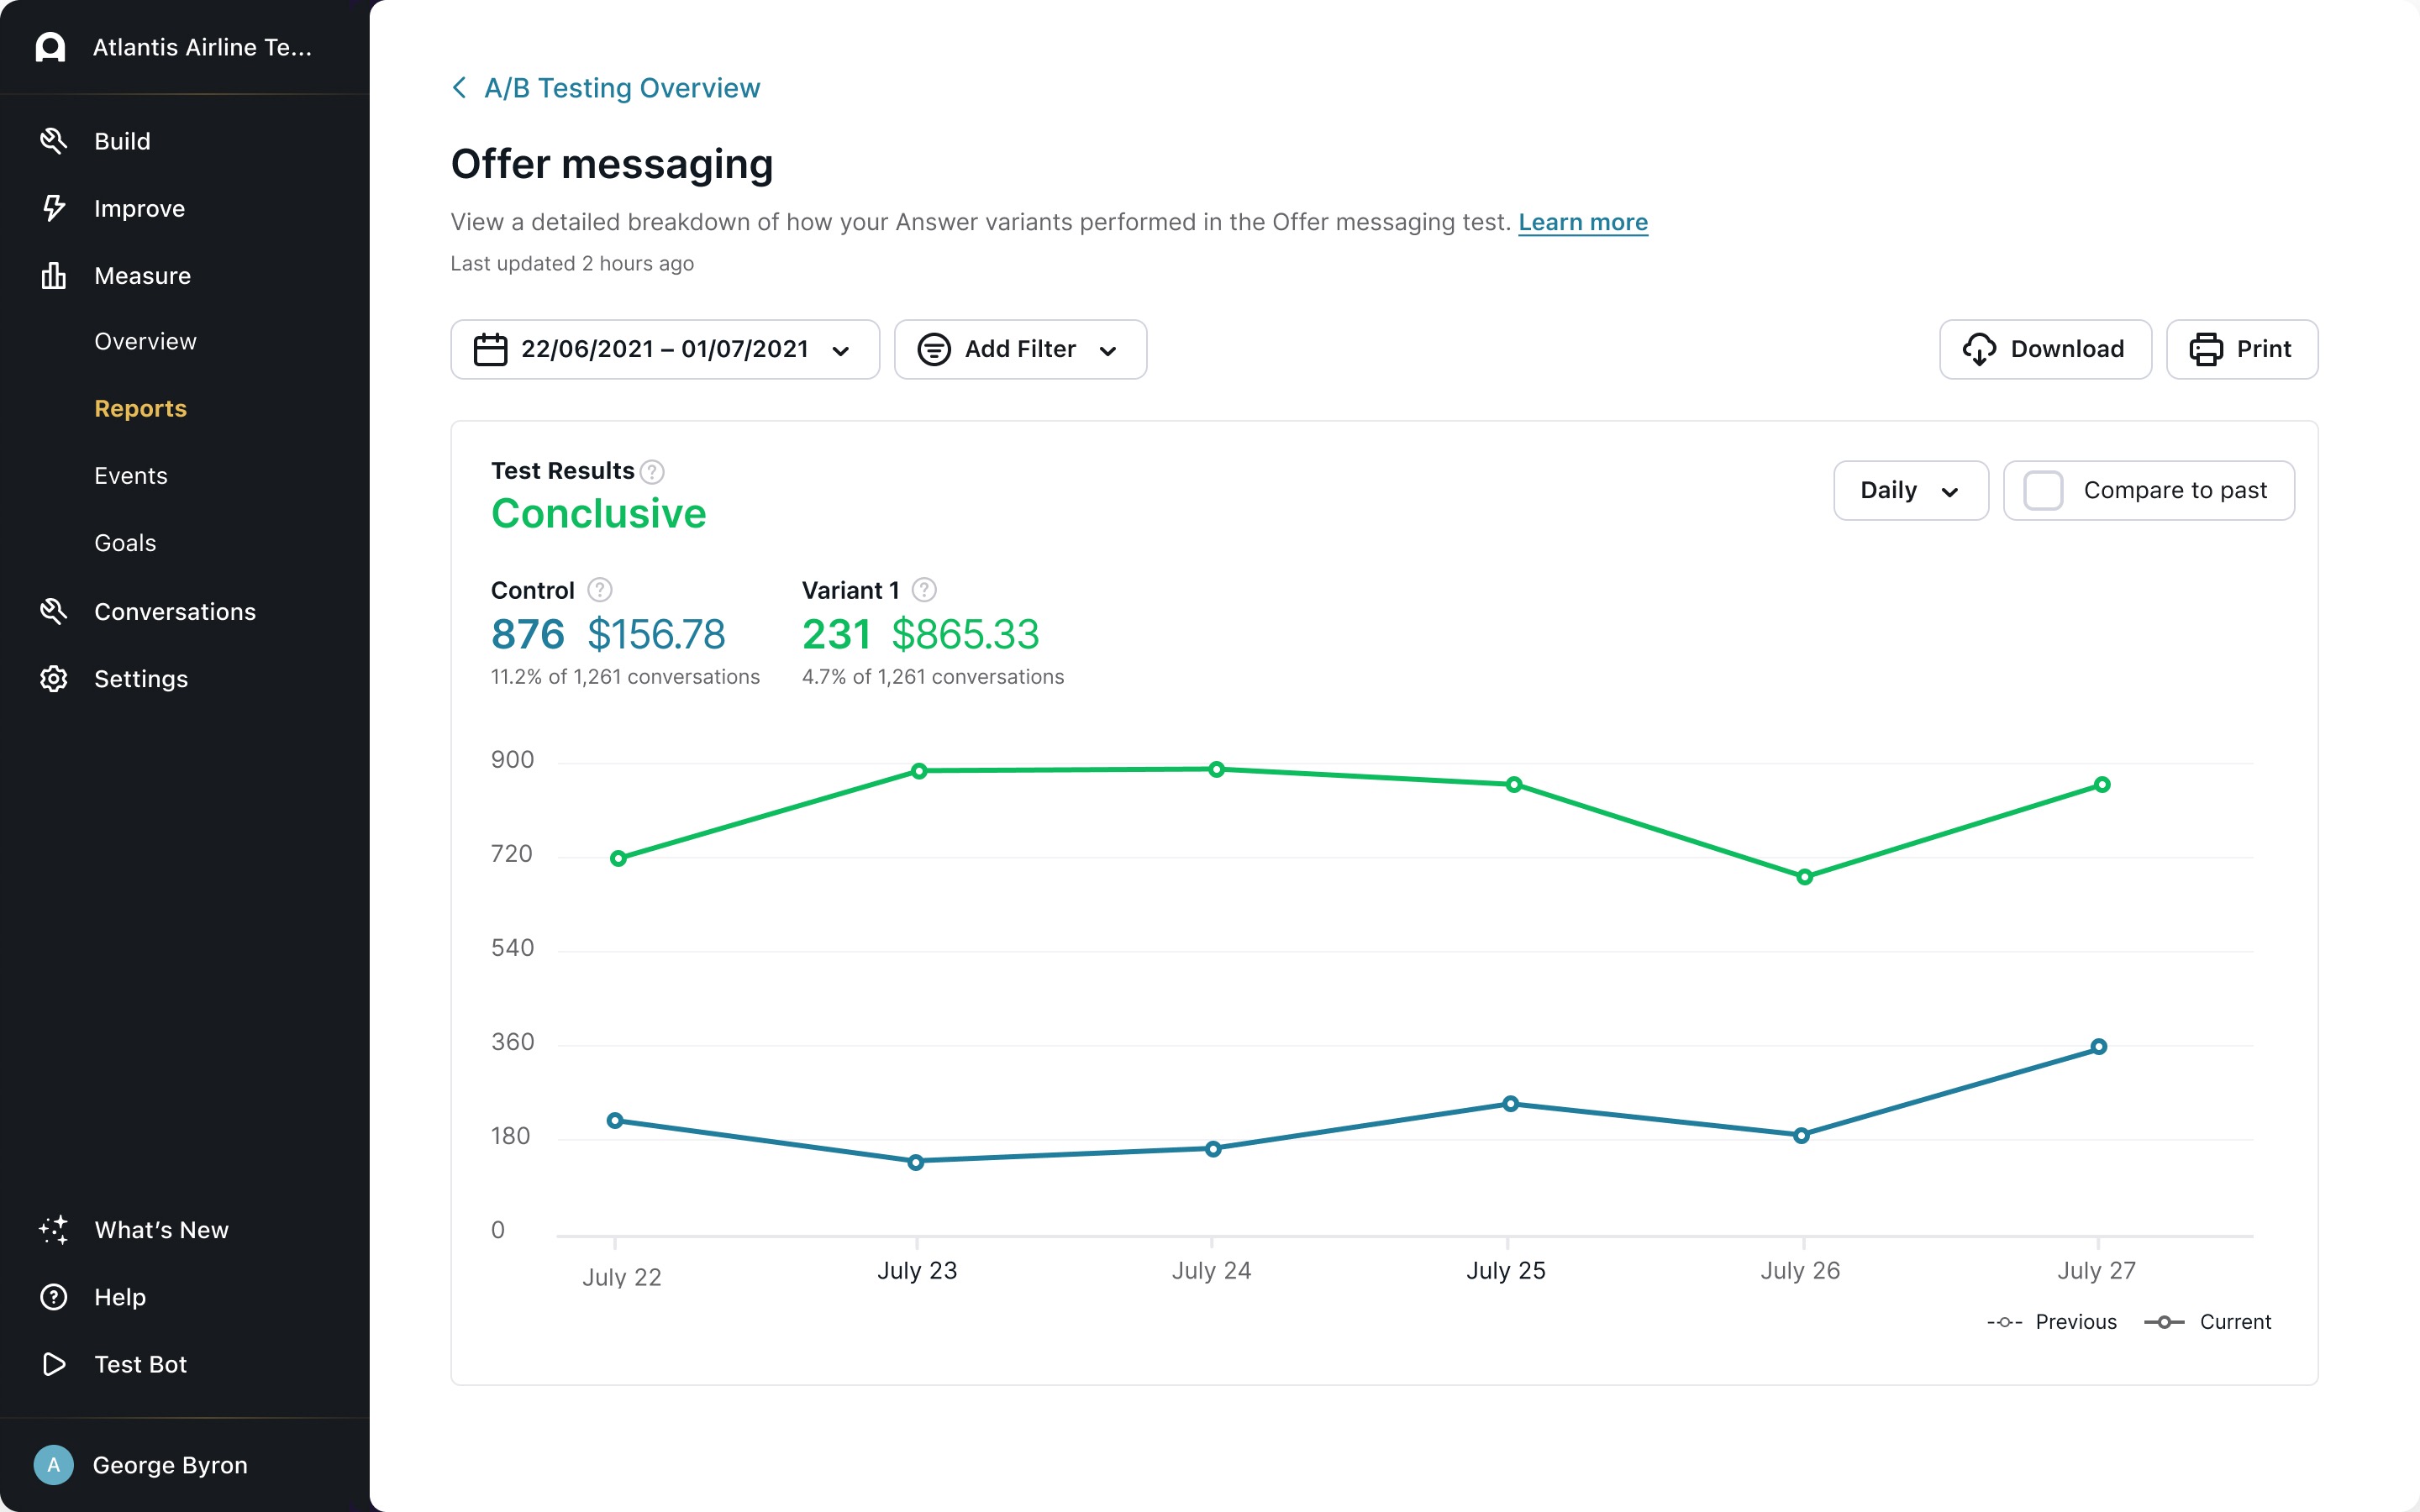
A/B Testing Breakdown
View a detailed breakdown of how your Answer variants performed. This breakdown appears when you click onto a specific A/B test to see how it performed. For more information on A/B testing, see Run an A/B test.
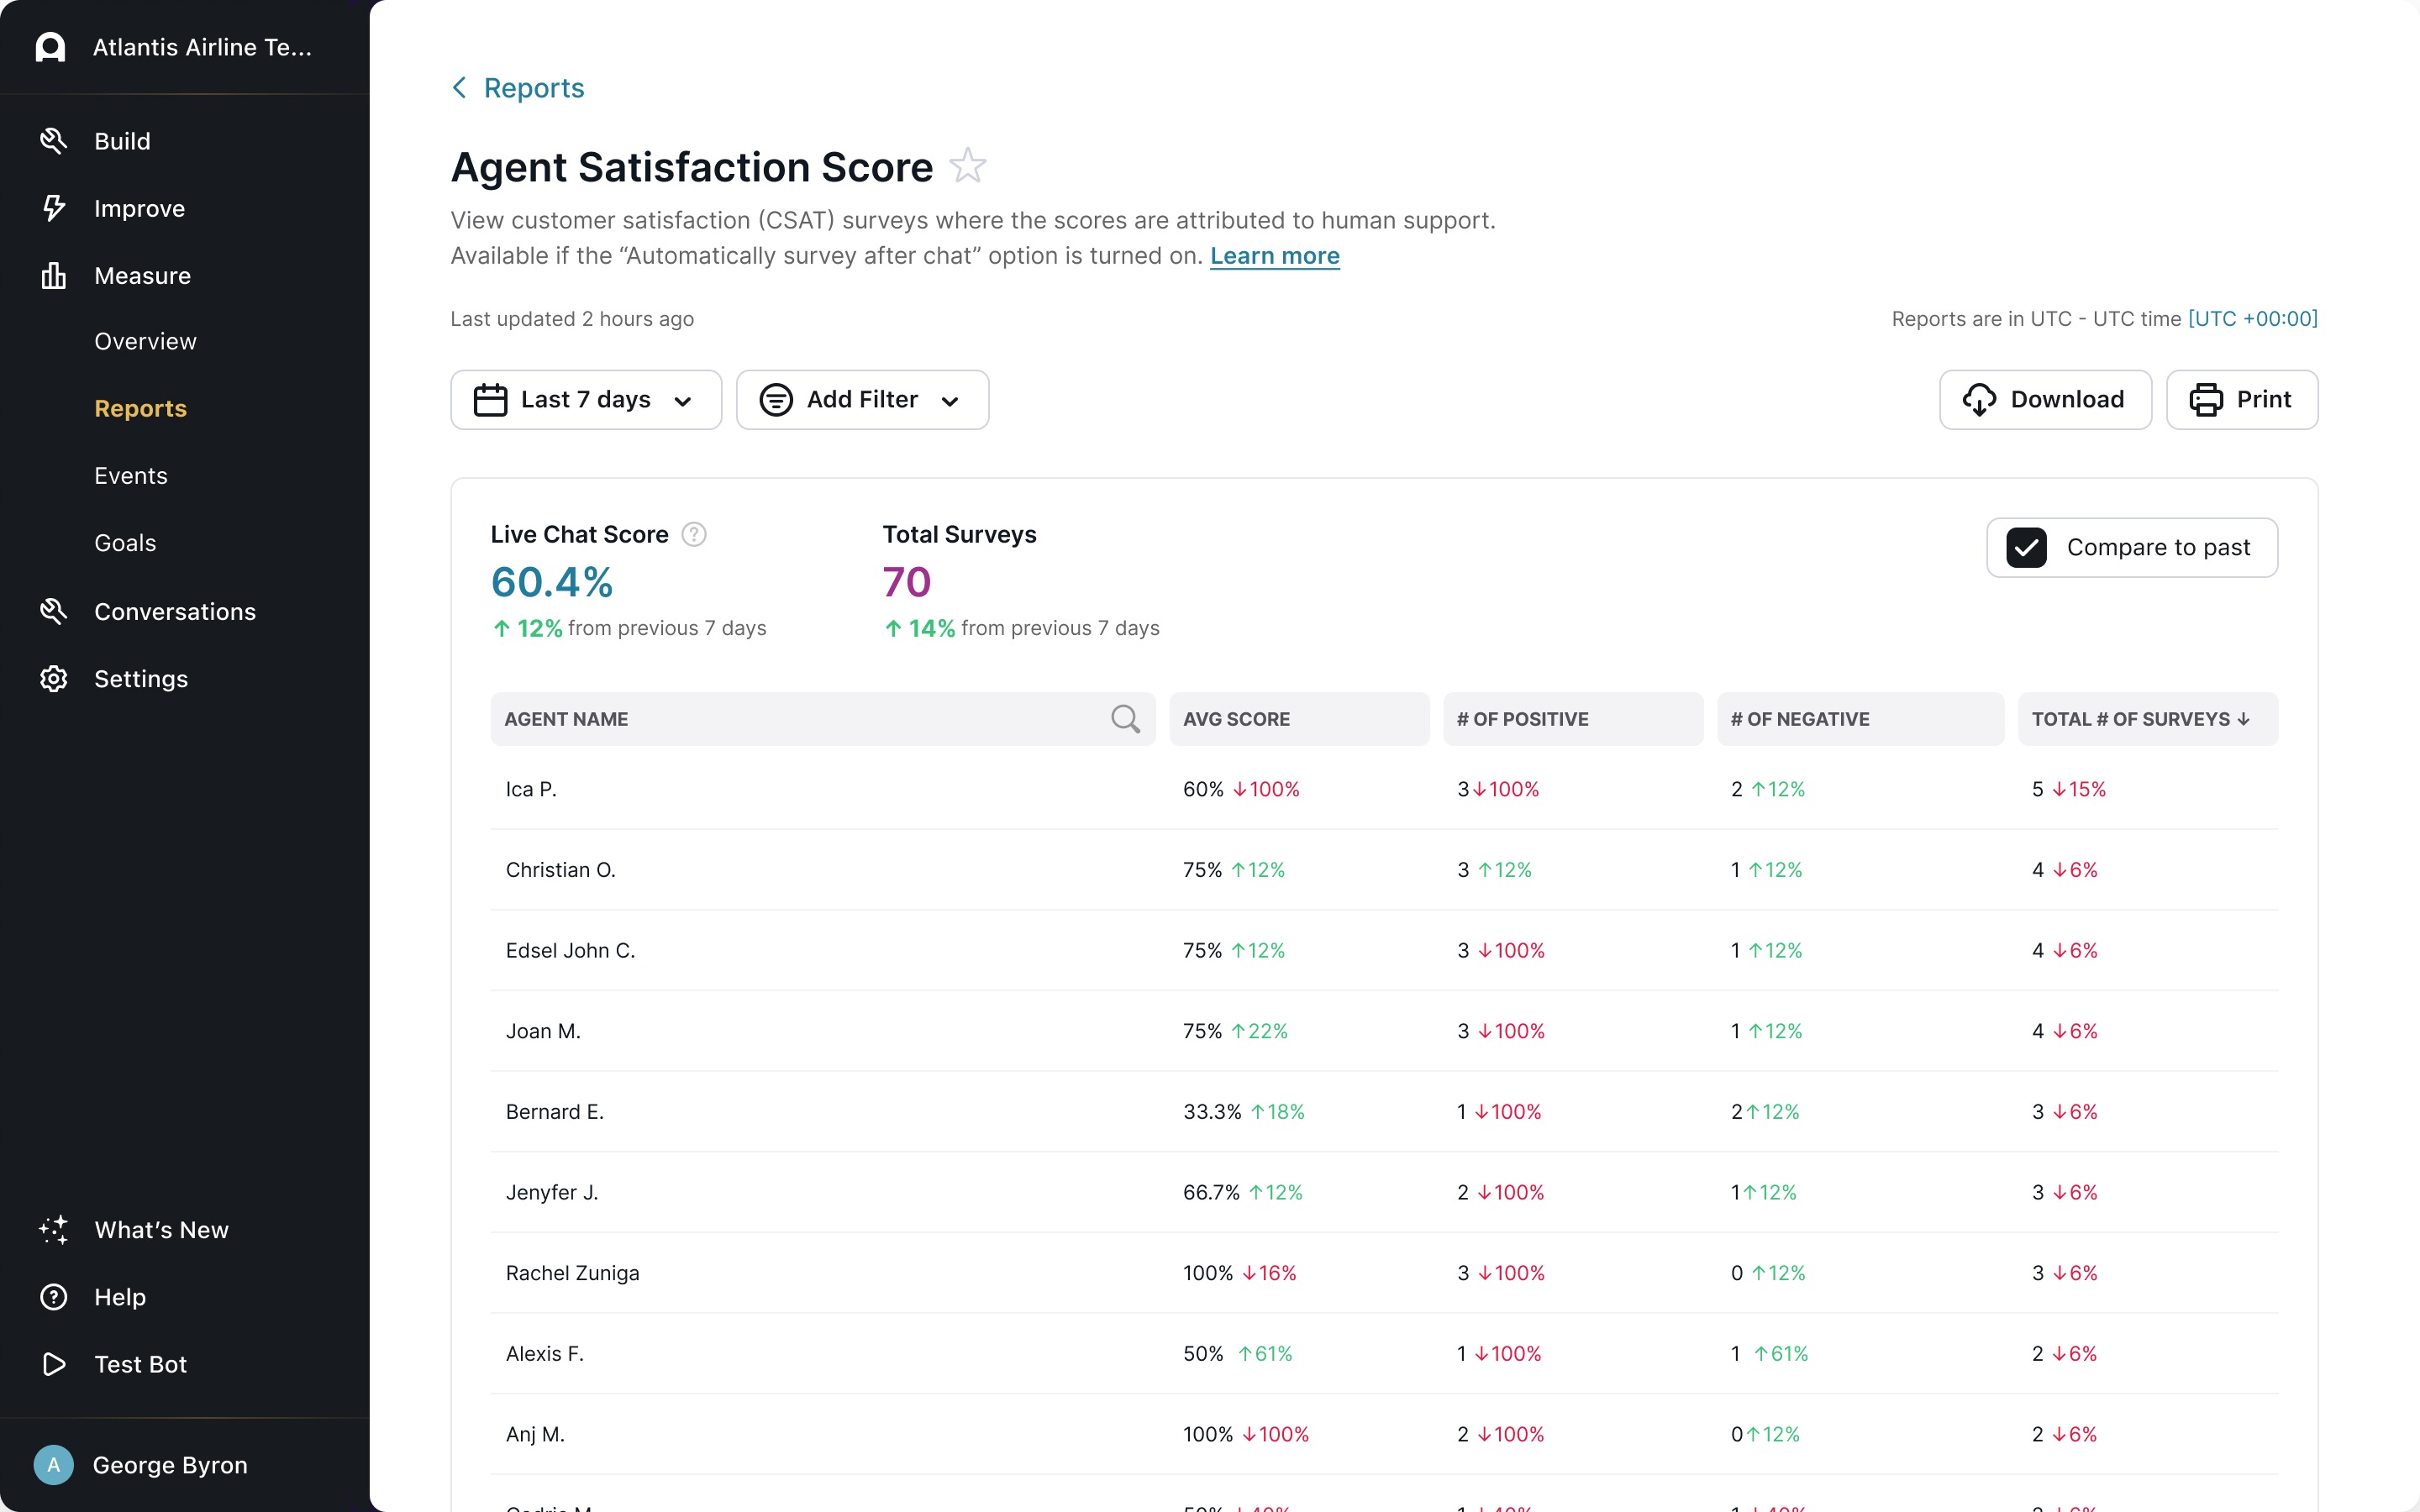
Agent Satisfaction Score
View customer satisfaction (CSAT) surveys where the scores are attributed to human support, available if the “Automatically survey after chat” option is turned on.
When you filter this report by date, it uses the date that the user submitted their satisfaction survey, rather than the date the conversation started. As a result, the number of conversations that appear in this report may vary from other reports.
There are four ways you can set up customer satisfaction reviews, each with different scales for recording feedback:
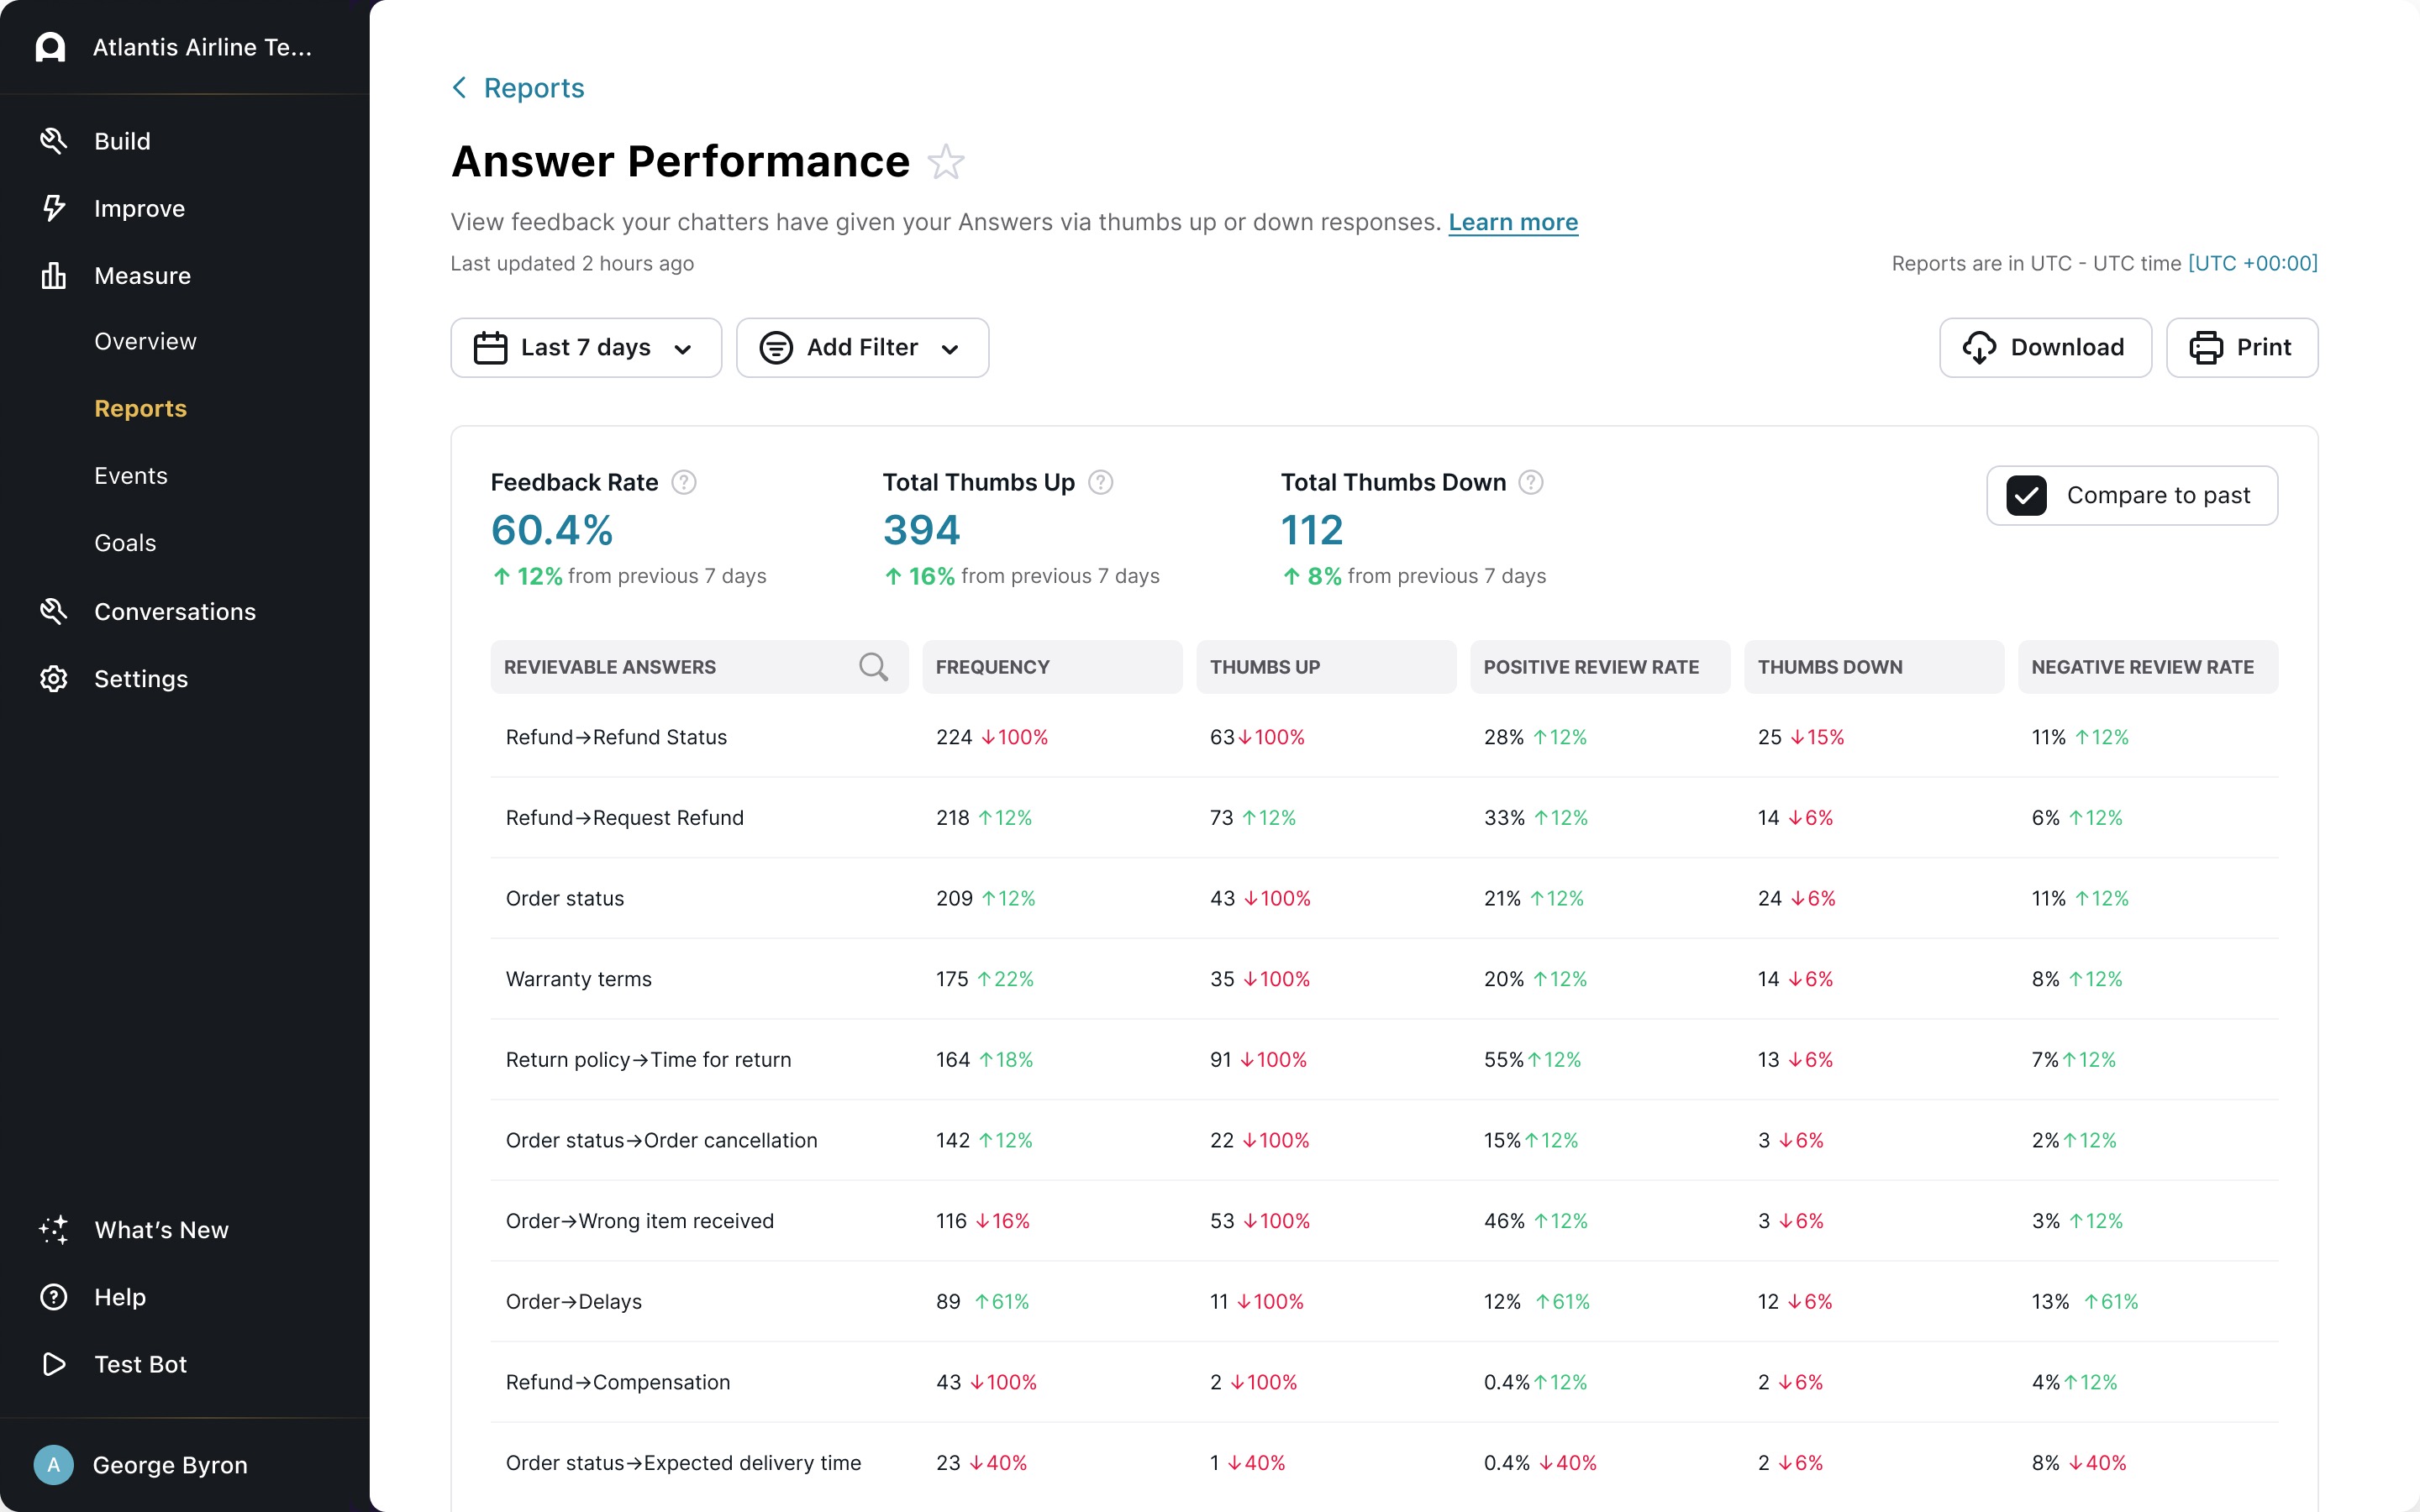
Answer Performance
View feedback your chatters have given your Answers via thumbs up or down responses, or via the Positive Review or Negative Review locked Answers. For more information, see Improve Answer training using chatter feedback.
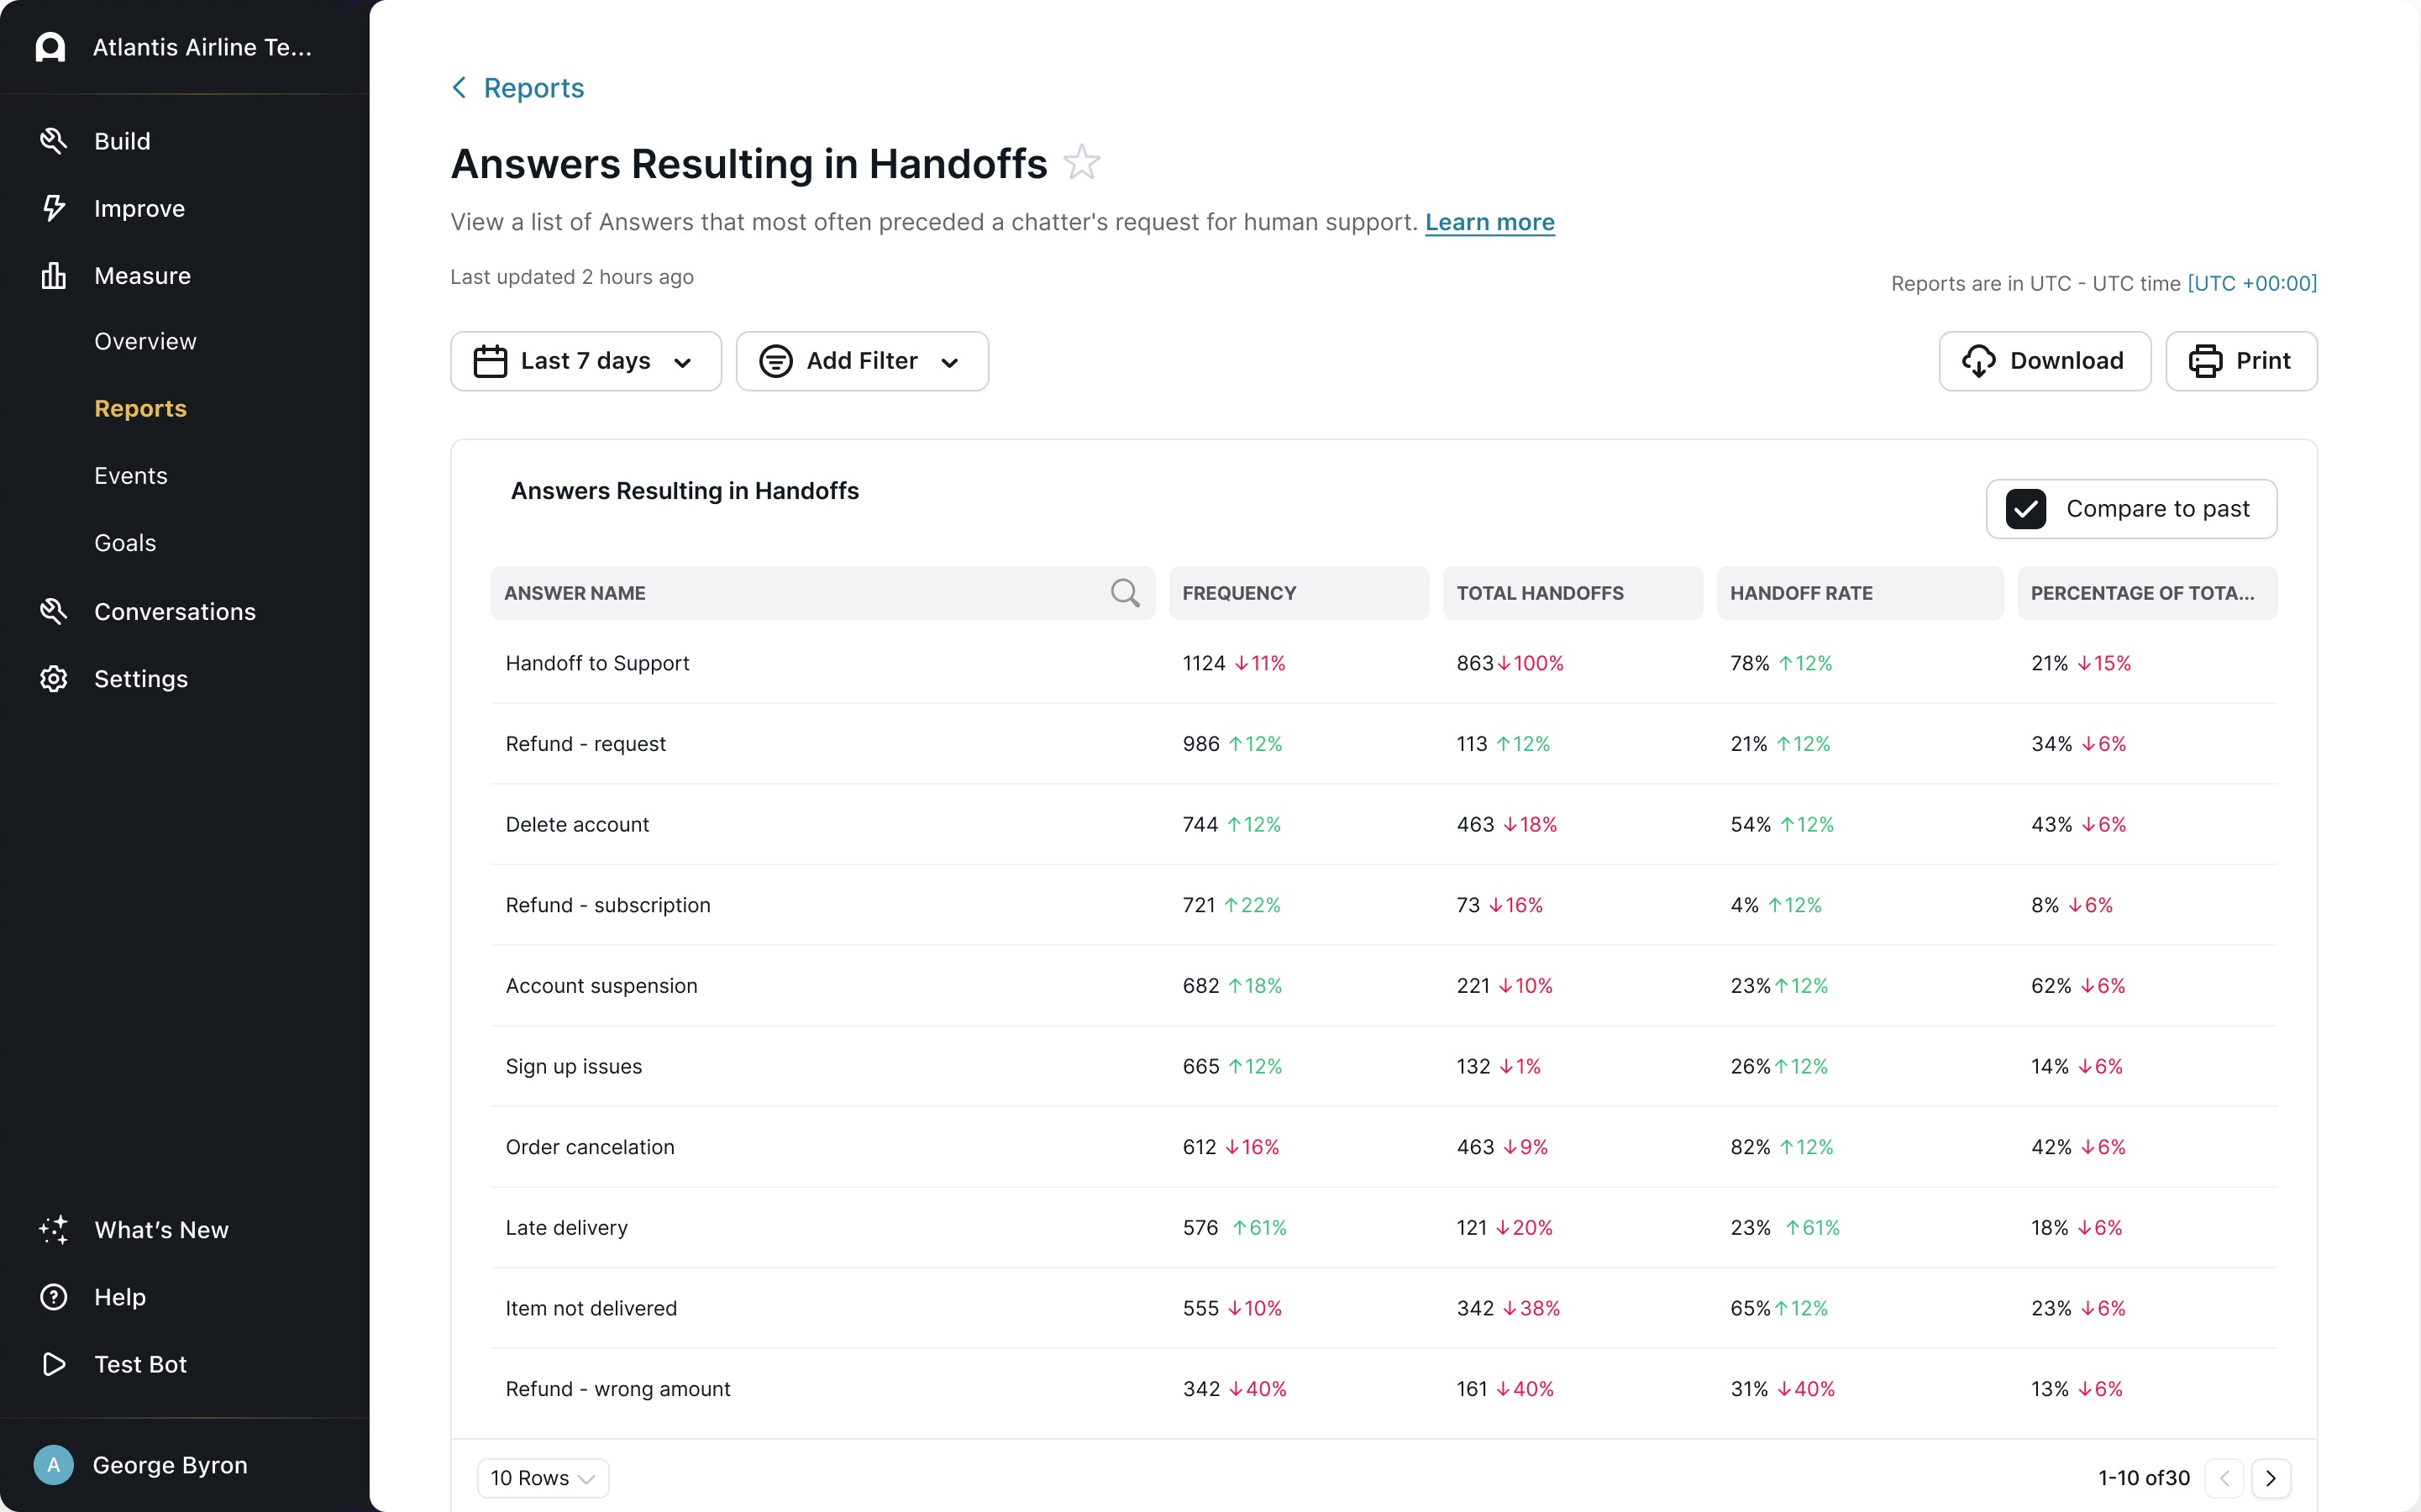
Answers Resulting in Handoffs
View a list of Answers that most often preceded a chatter’s request for human support.
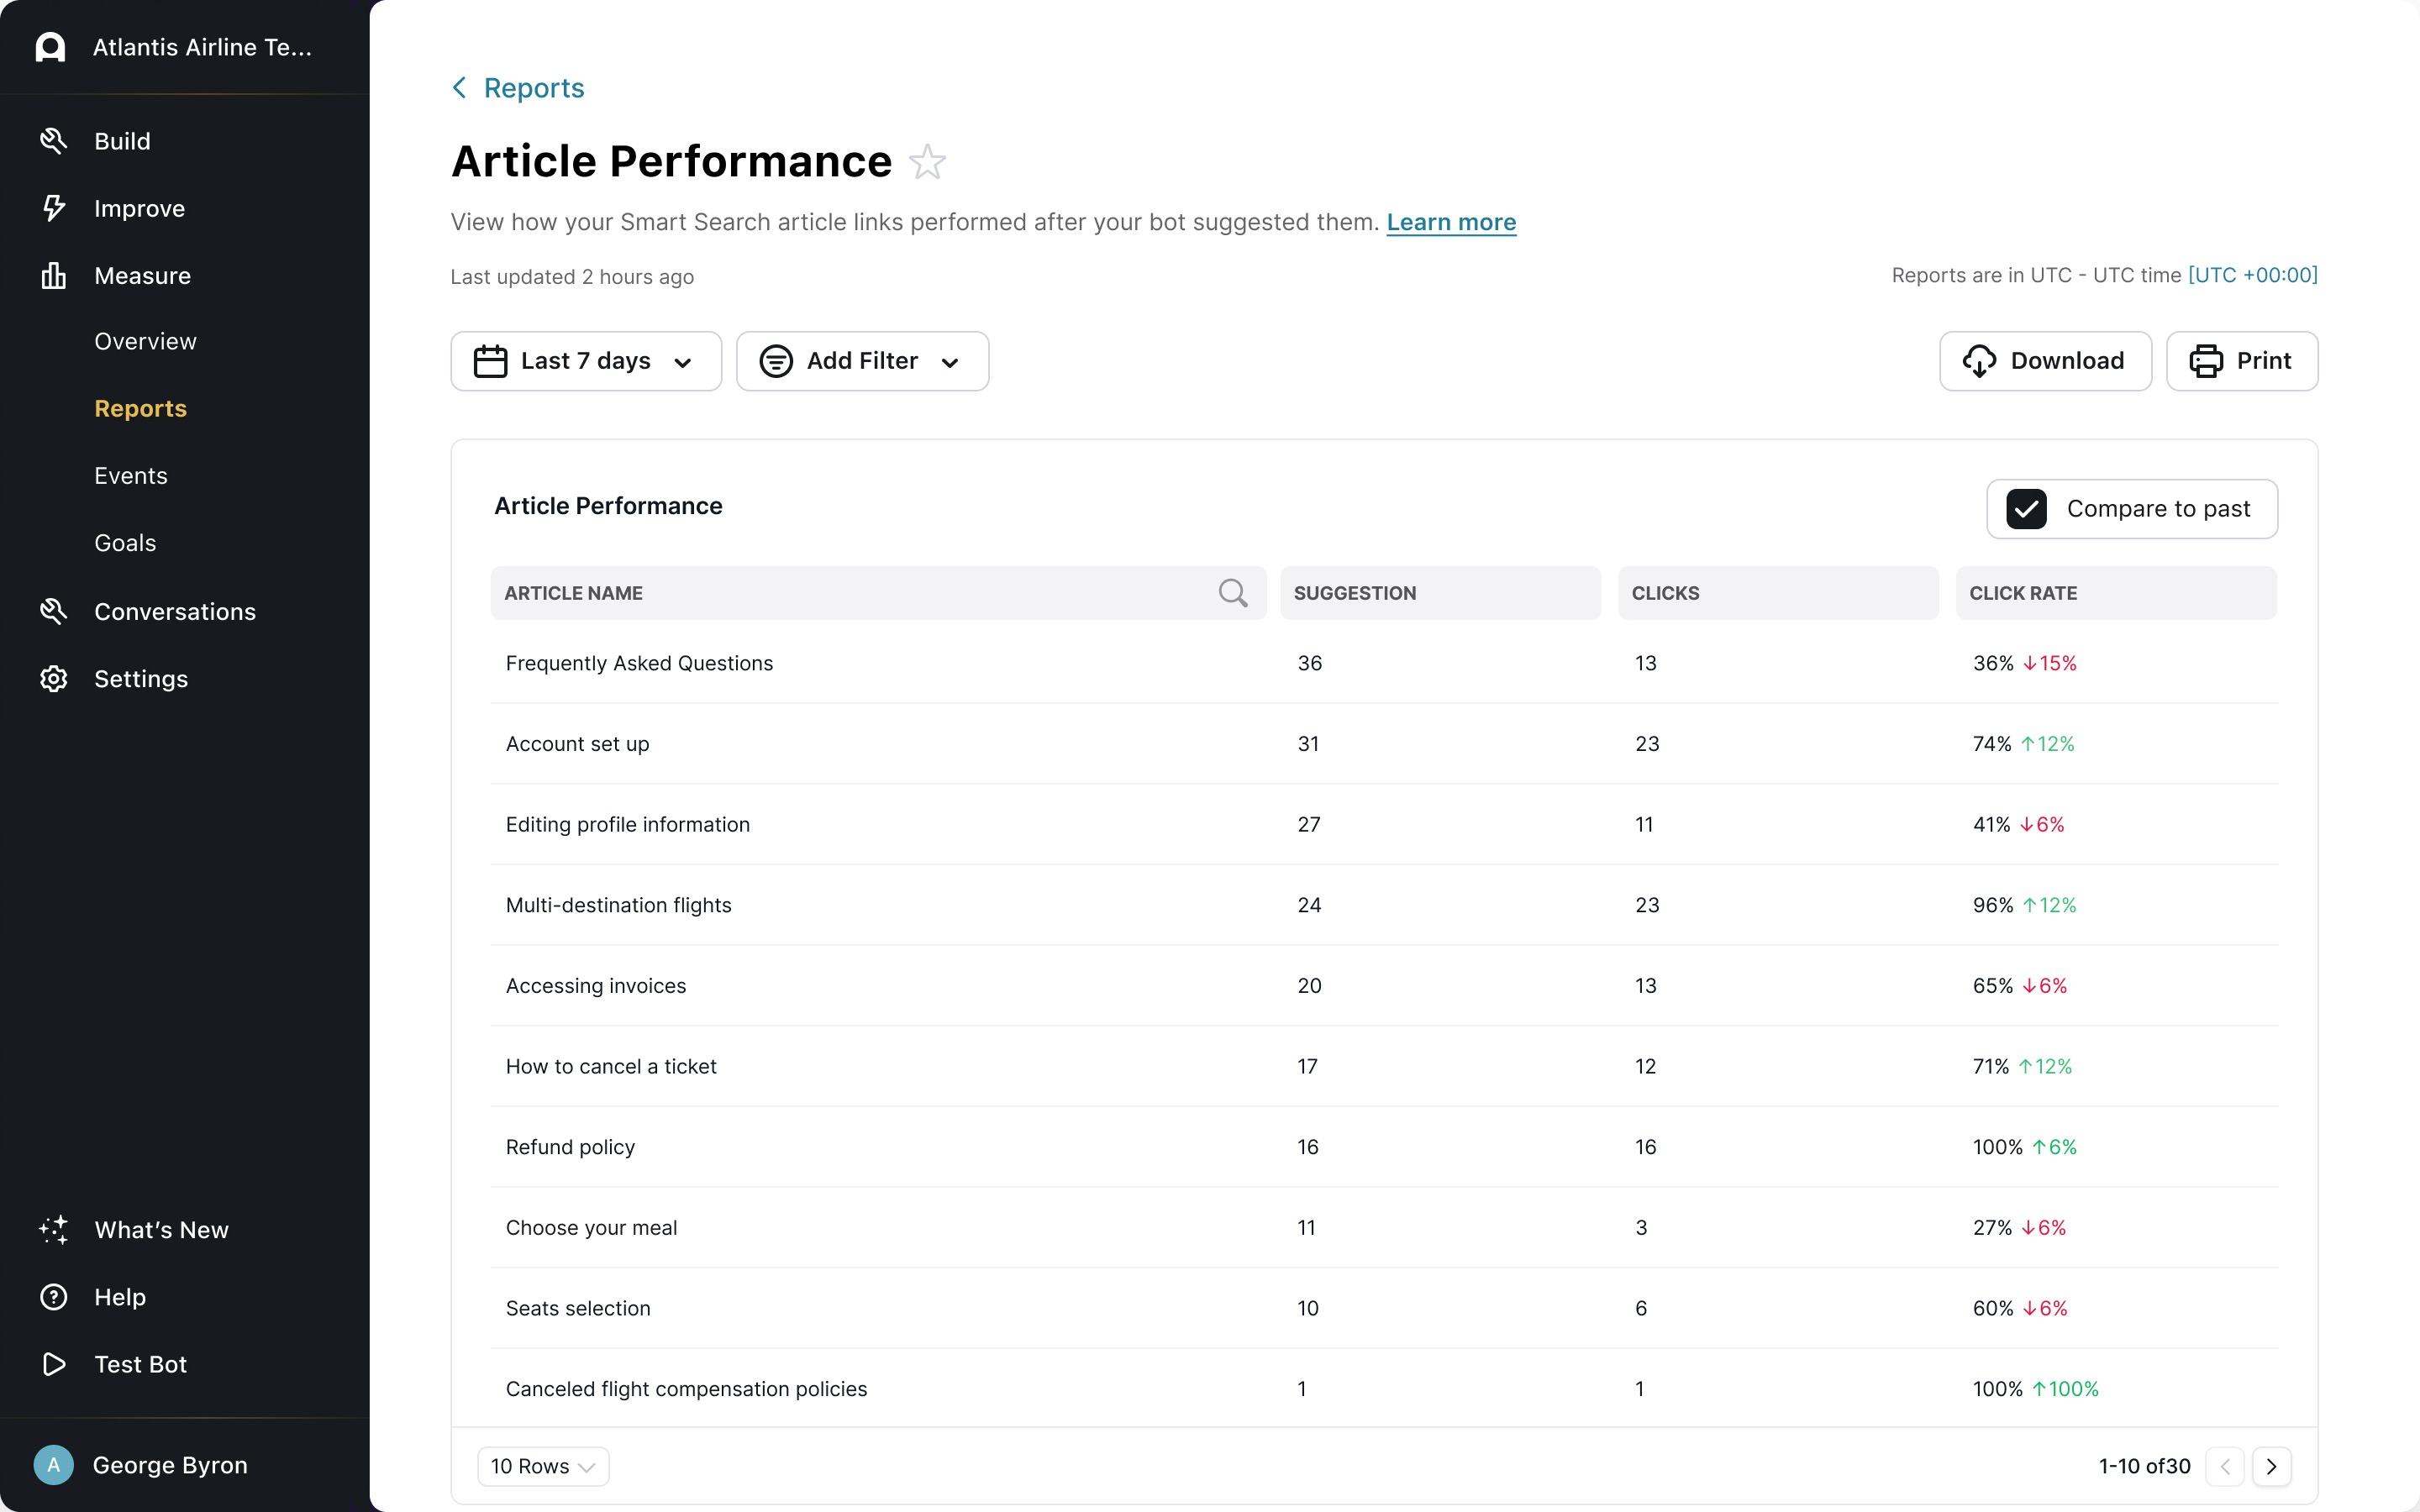
Article Performance
View how your knowledge base article links performed after your bot suggested them. For more information, see Let chatters search your Zendesk or Salesforce knowledge base content.
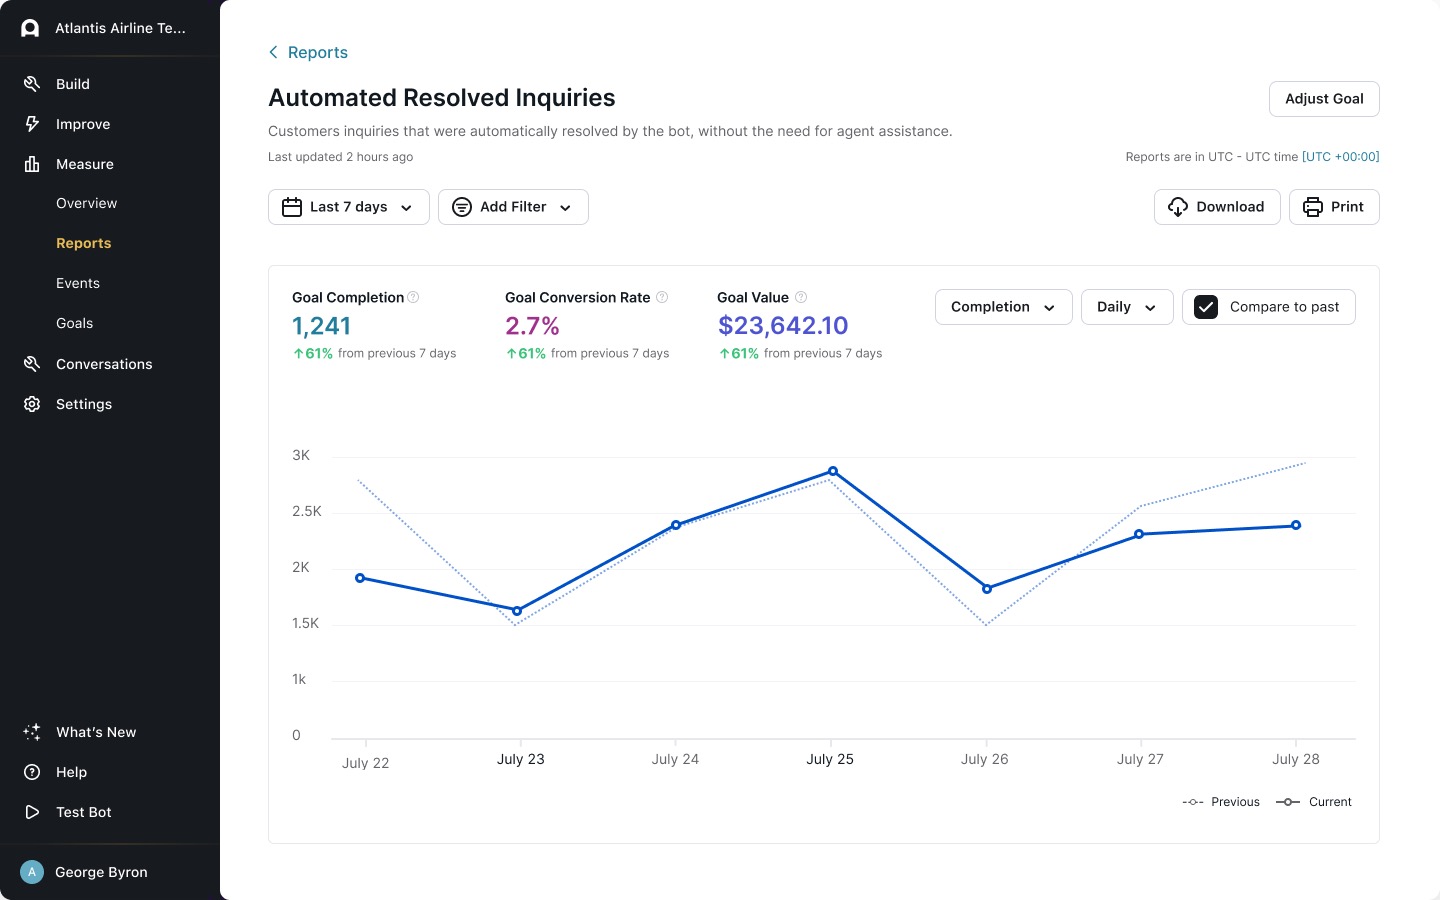
Automated Resolution Rate
The automated resolution rate is an analysis of how many conversations your bot was able to resolve automatically.
To calculate the automated resolution rate, your bot takes a random sample of your bot’s conversations, then analyzes each conversation in the sample to understand both the chatter’s intent and the bot’s response. Based on that analysis, it then assigns a classification of either Resolved or Not Resolved to each conversation in the sample.
For a conversation to be considered automatically resolved, the conversation must be:
-
Relevant - Ada effectively understood the chatter’s inquiry, and provided directly related information or assistance.
-
Accurate - Ada provided correct, up-to-date information.
-
Safe - Ada interacts with the chatter in a respectful manner and avoided engaging in topics that caused danger or harm.
-
Contained - Ada addressed the chatter’s inquiry without having to hand them off to a human agent.
While Containment Rate can be a useful metric to get a quick glance of the proportion of bot conversations that didn’t escalate to a human agent, automated resolution rate takes it a step further. By measuring the success of those conversations and the content they contain, you can get a much better idea of how helpful your bot content really is.
In the Conversations portion of the Automated Resolution Rate page, you can view a summary of what each chatter was looking for, how your bot classified the conversation, and its reasoning. If you need more information, you can click a row to view the entire conversation transcript.
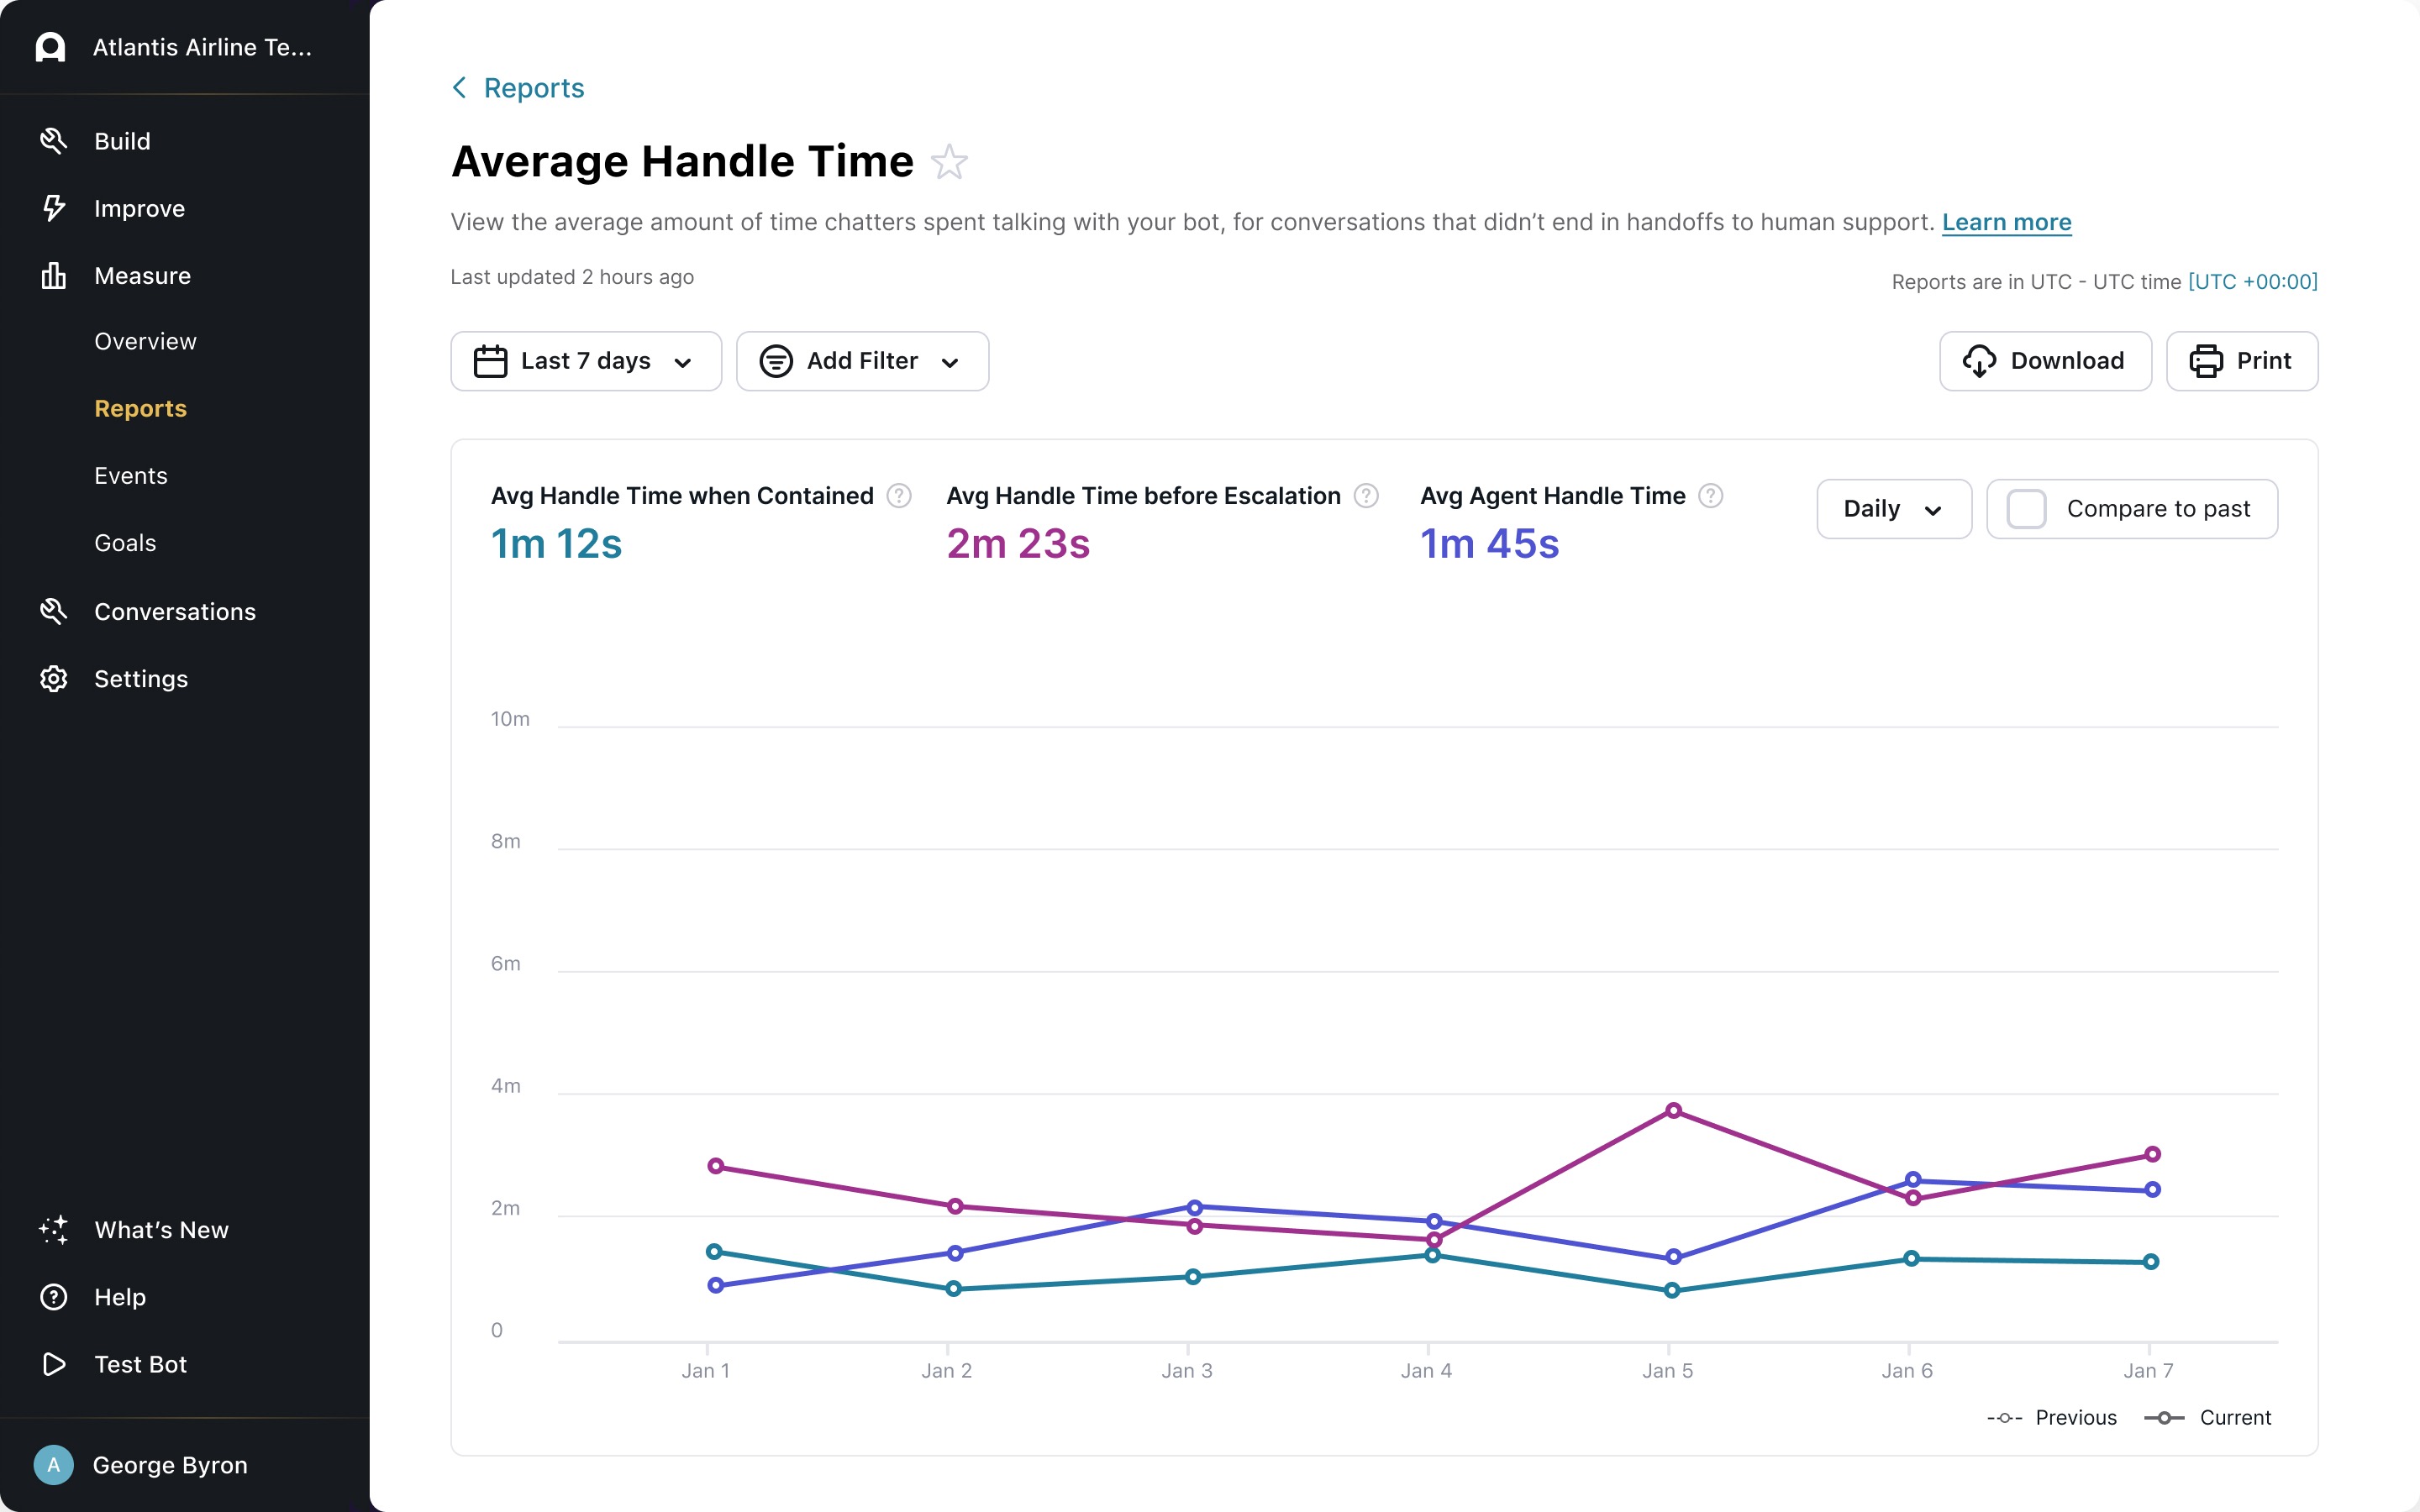
Average Handle Time
View the average amount of time chatters spent talking with your bot, for conversations that didn’t end in handoffs to human support.
This report uses winsorization on all of its metrics. To handle outliers, your bot calculates the 90th percentile of all handle times. If a handle time is higher than the 90th percentile limit, your bot replaces it with the 90th percentile limit instead.
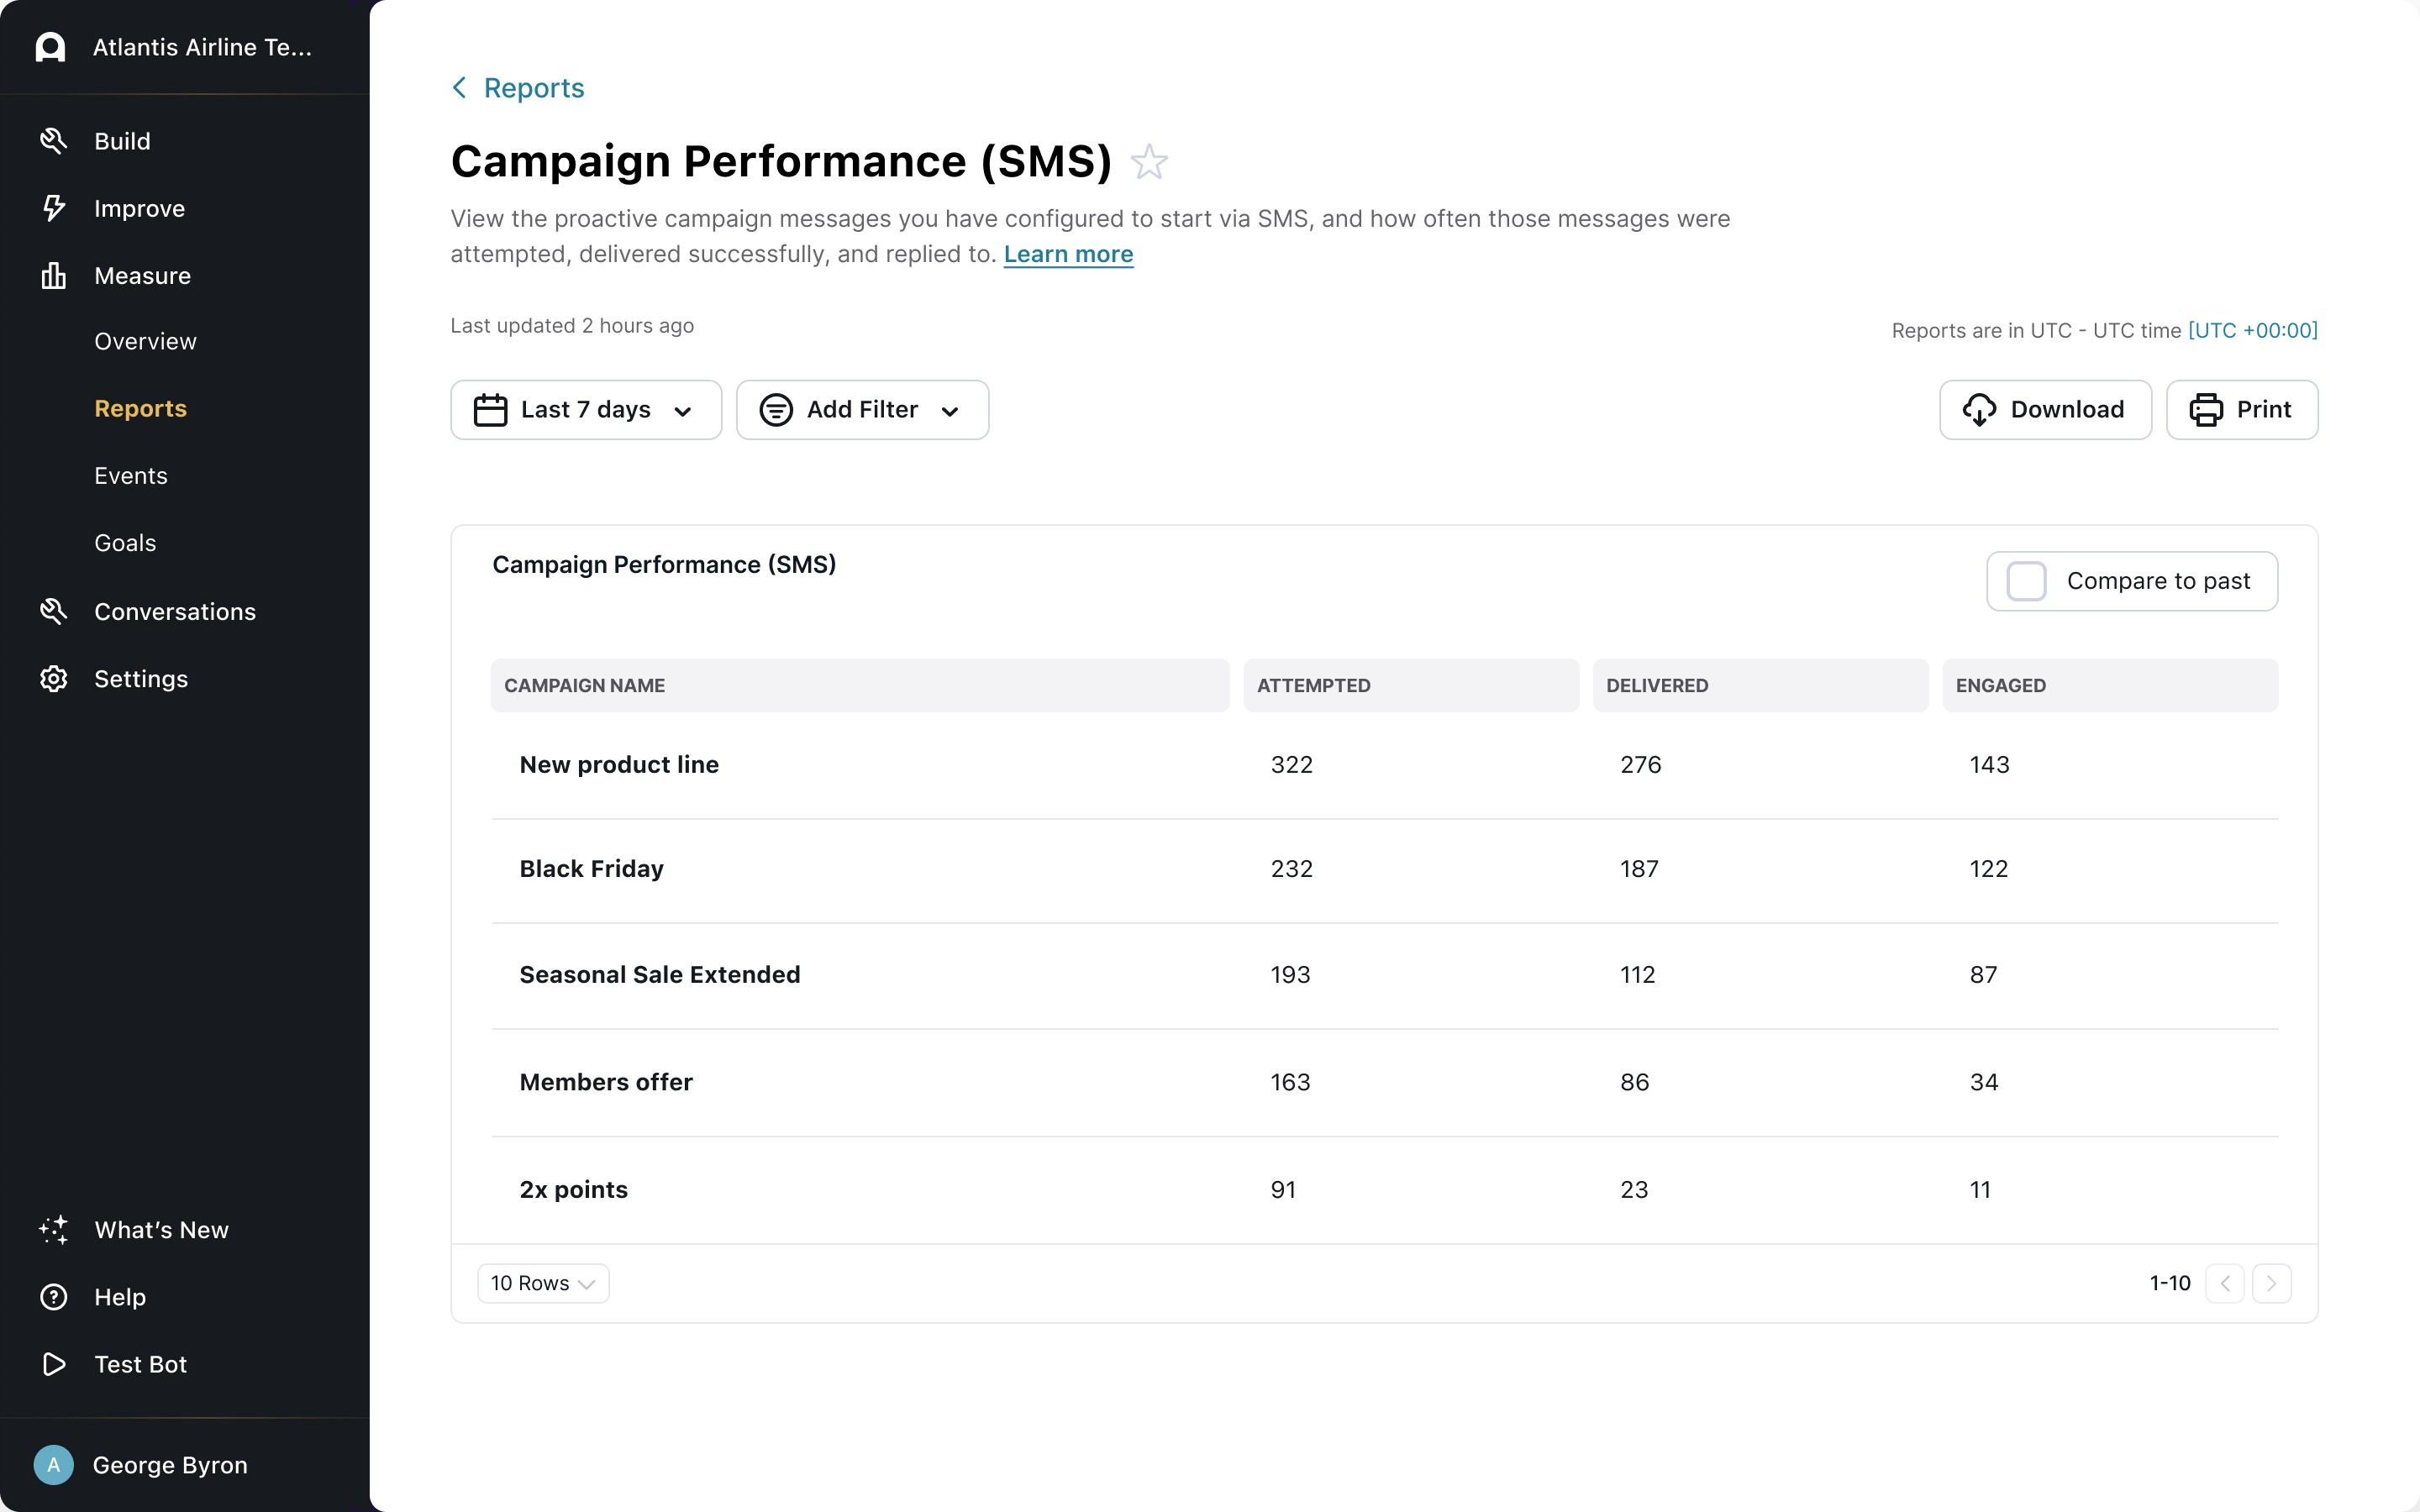
Campaign Performance (SMS)
View the proactive campaign messages you have configured to start via SMS, and how often those messages were attempted, delivered successfully, and replied to. For more information, see Start text conversations using proactive campaigns for SMS.
Unlike web content, there is no way to mark SMS conversations as test content. Be aware that this data may include data from your internal tests as a result.
Campaign Breakdown (SMS)
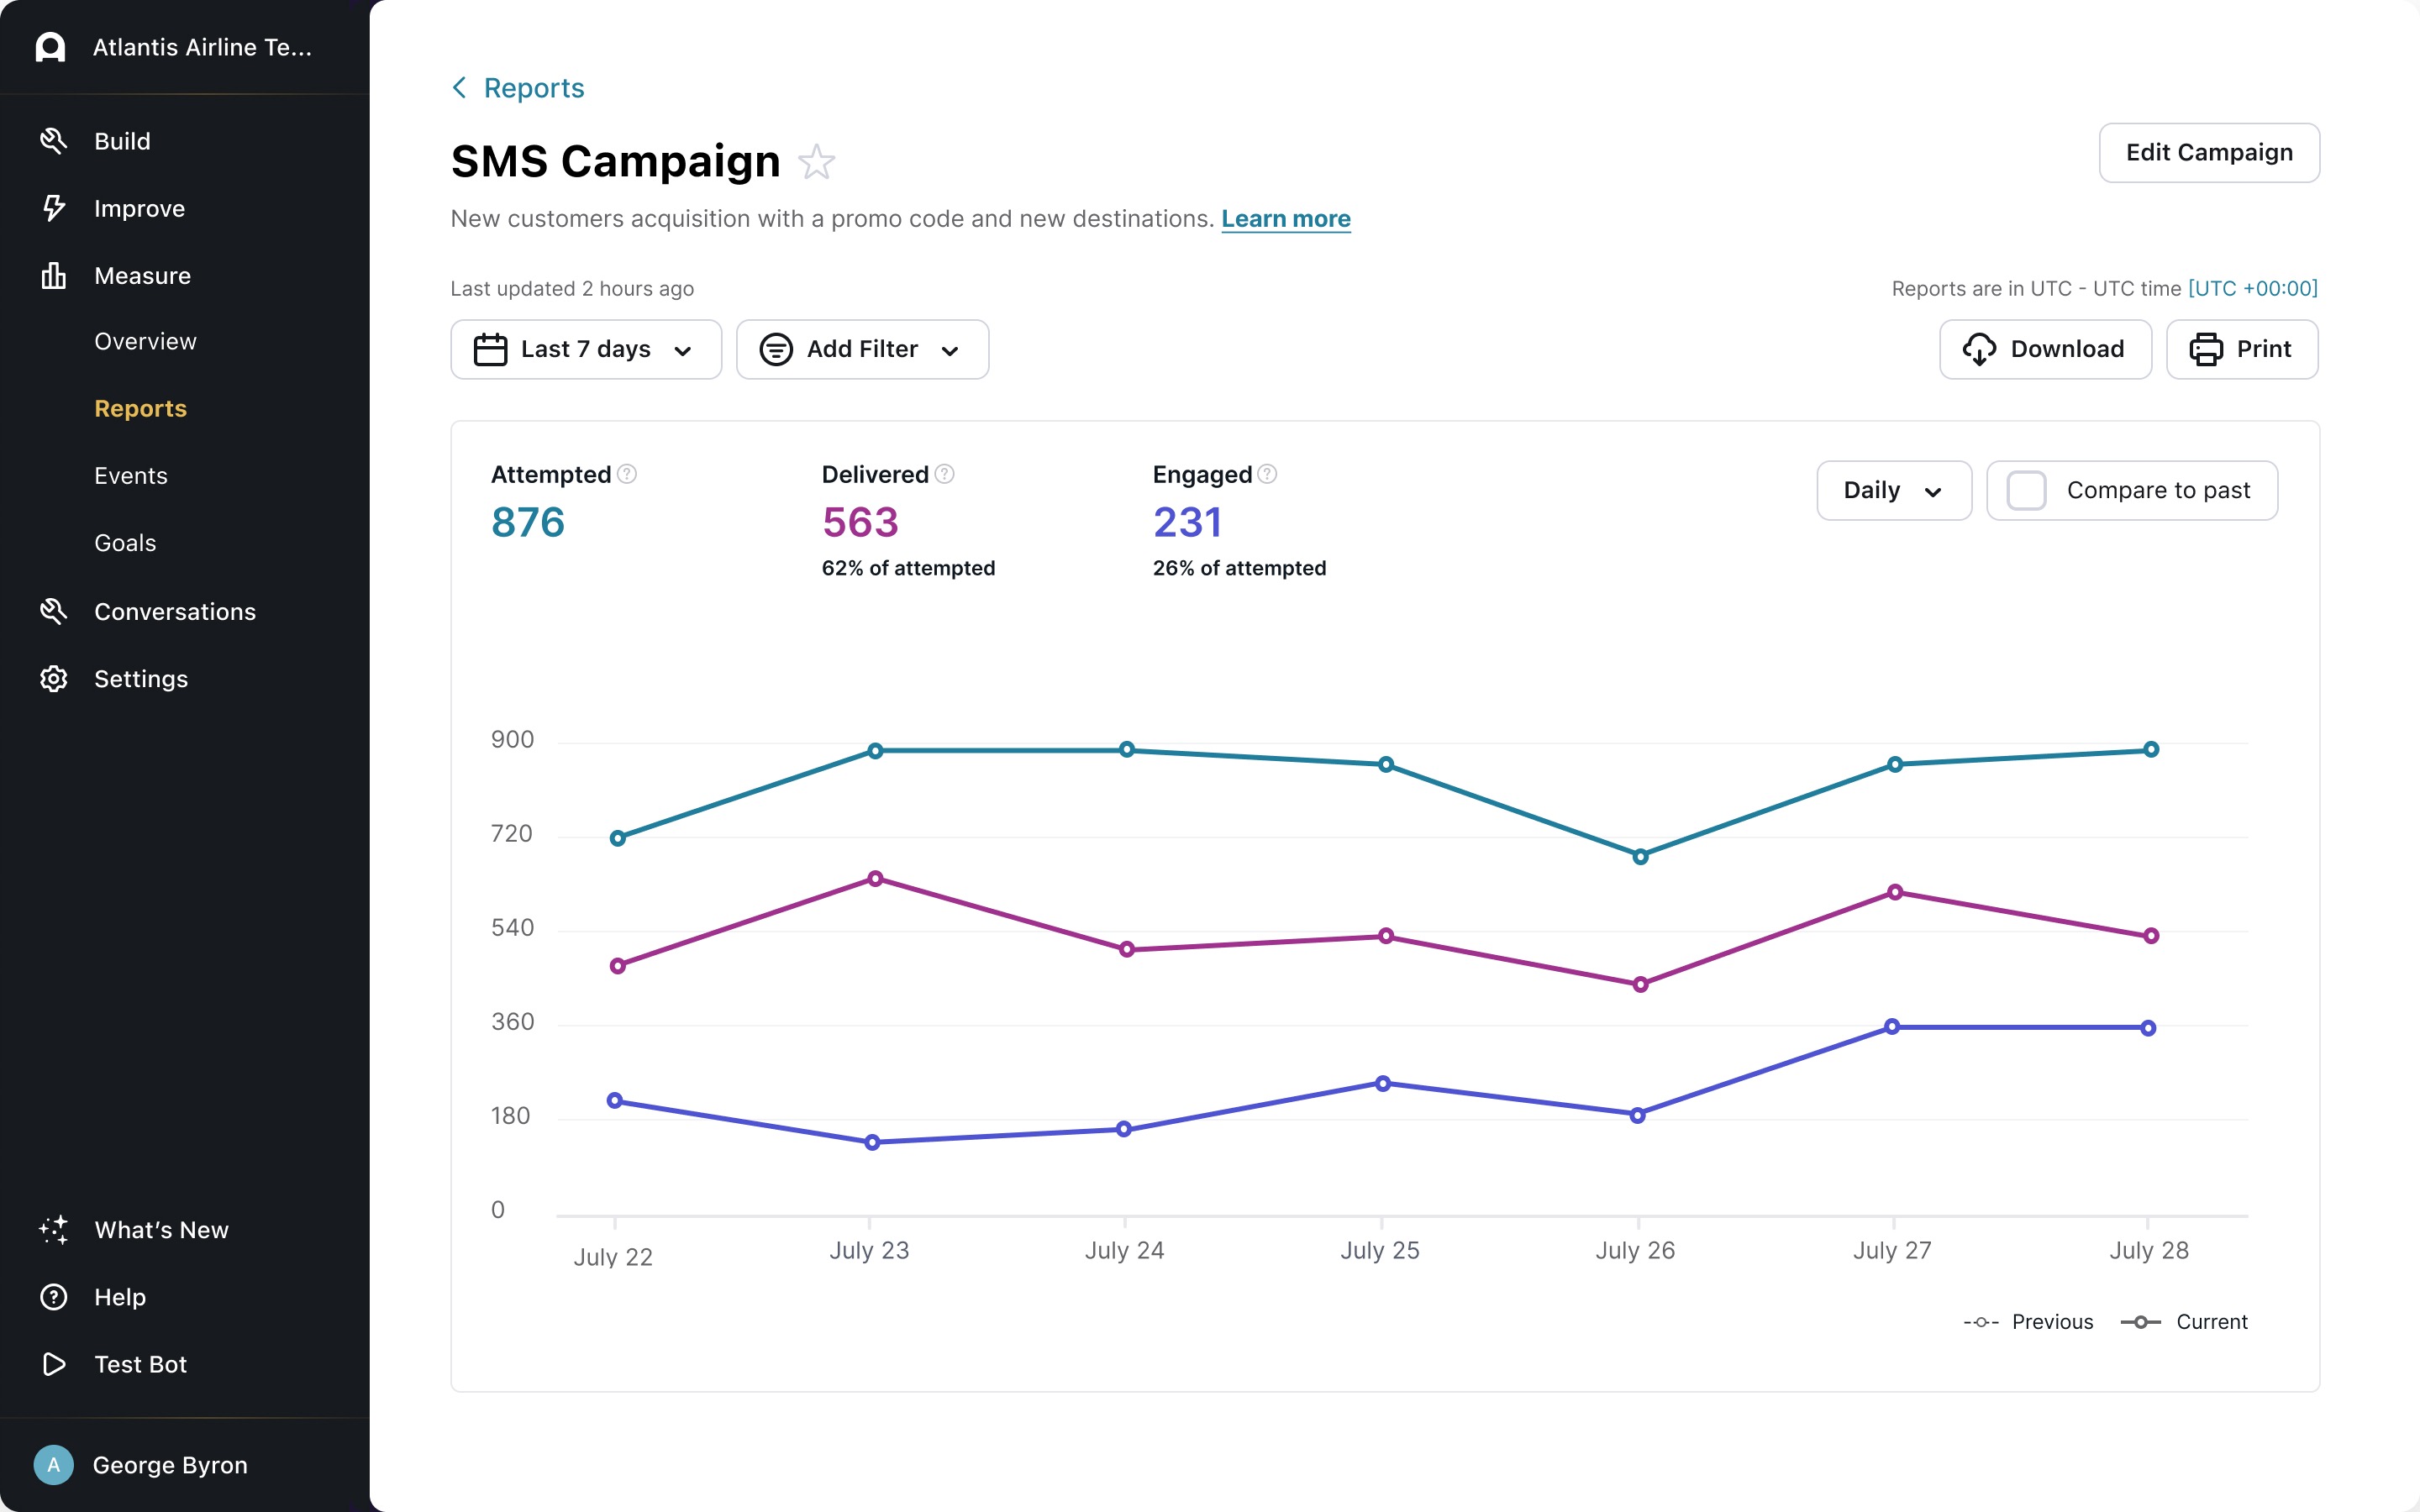
View how a specific SMS campaign has performed. For more information, see Start text conversations using proactive campaigns for SMS.
Unlike web content, there is no way to mark SMS conversations as test content. Be aware that this data may include data from your internal tests as a result.
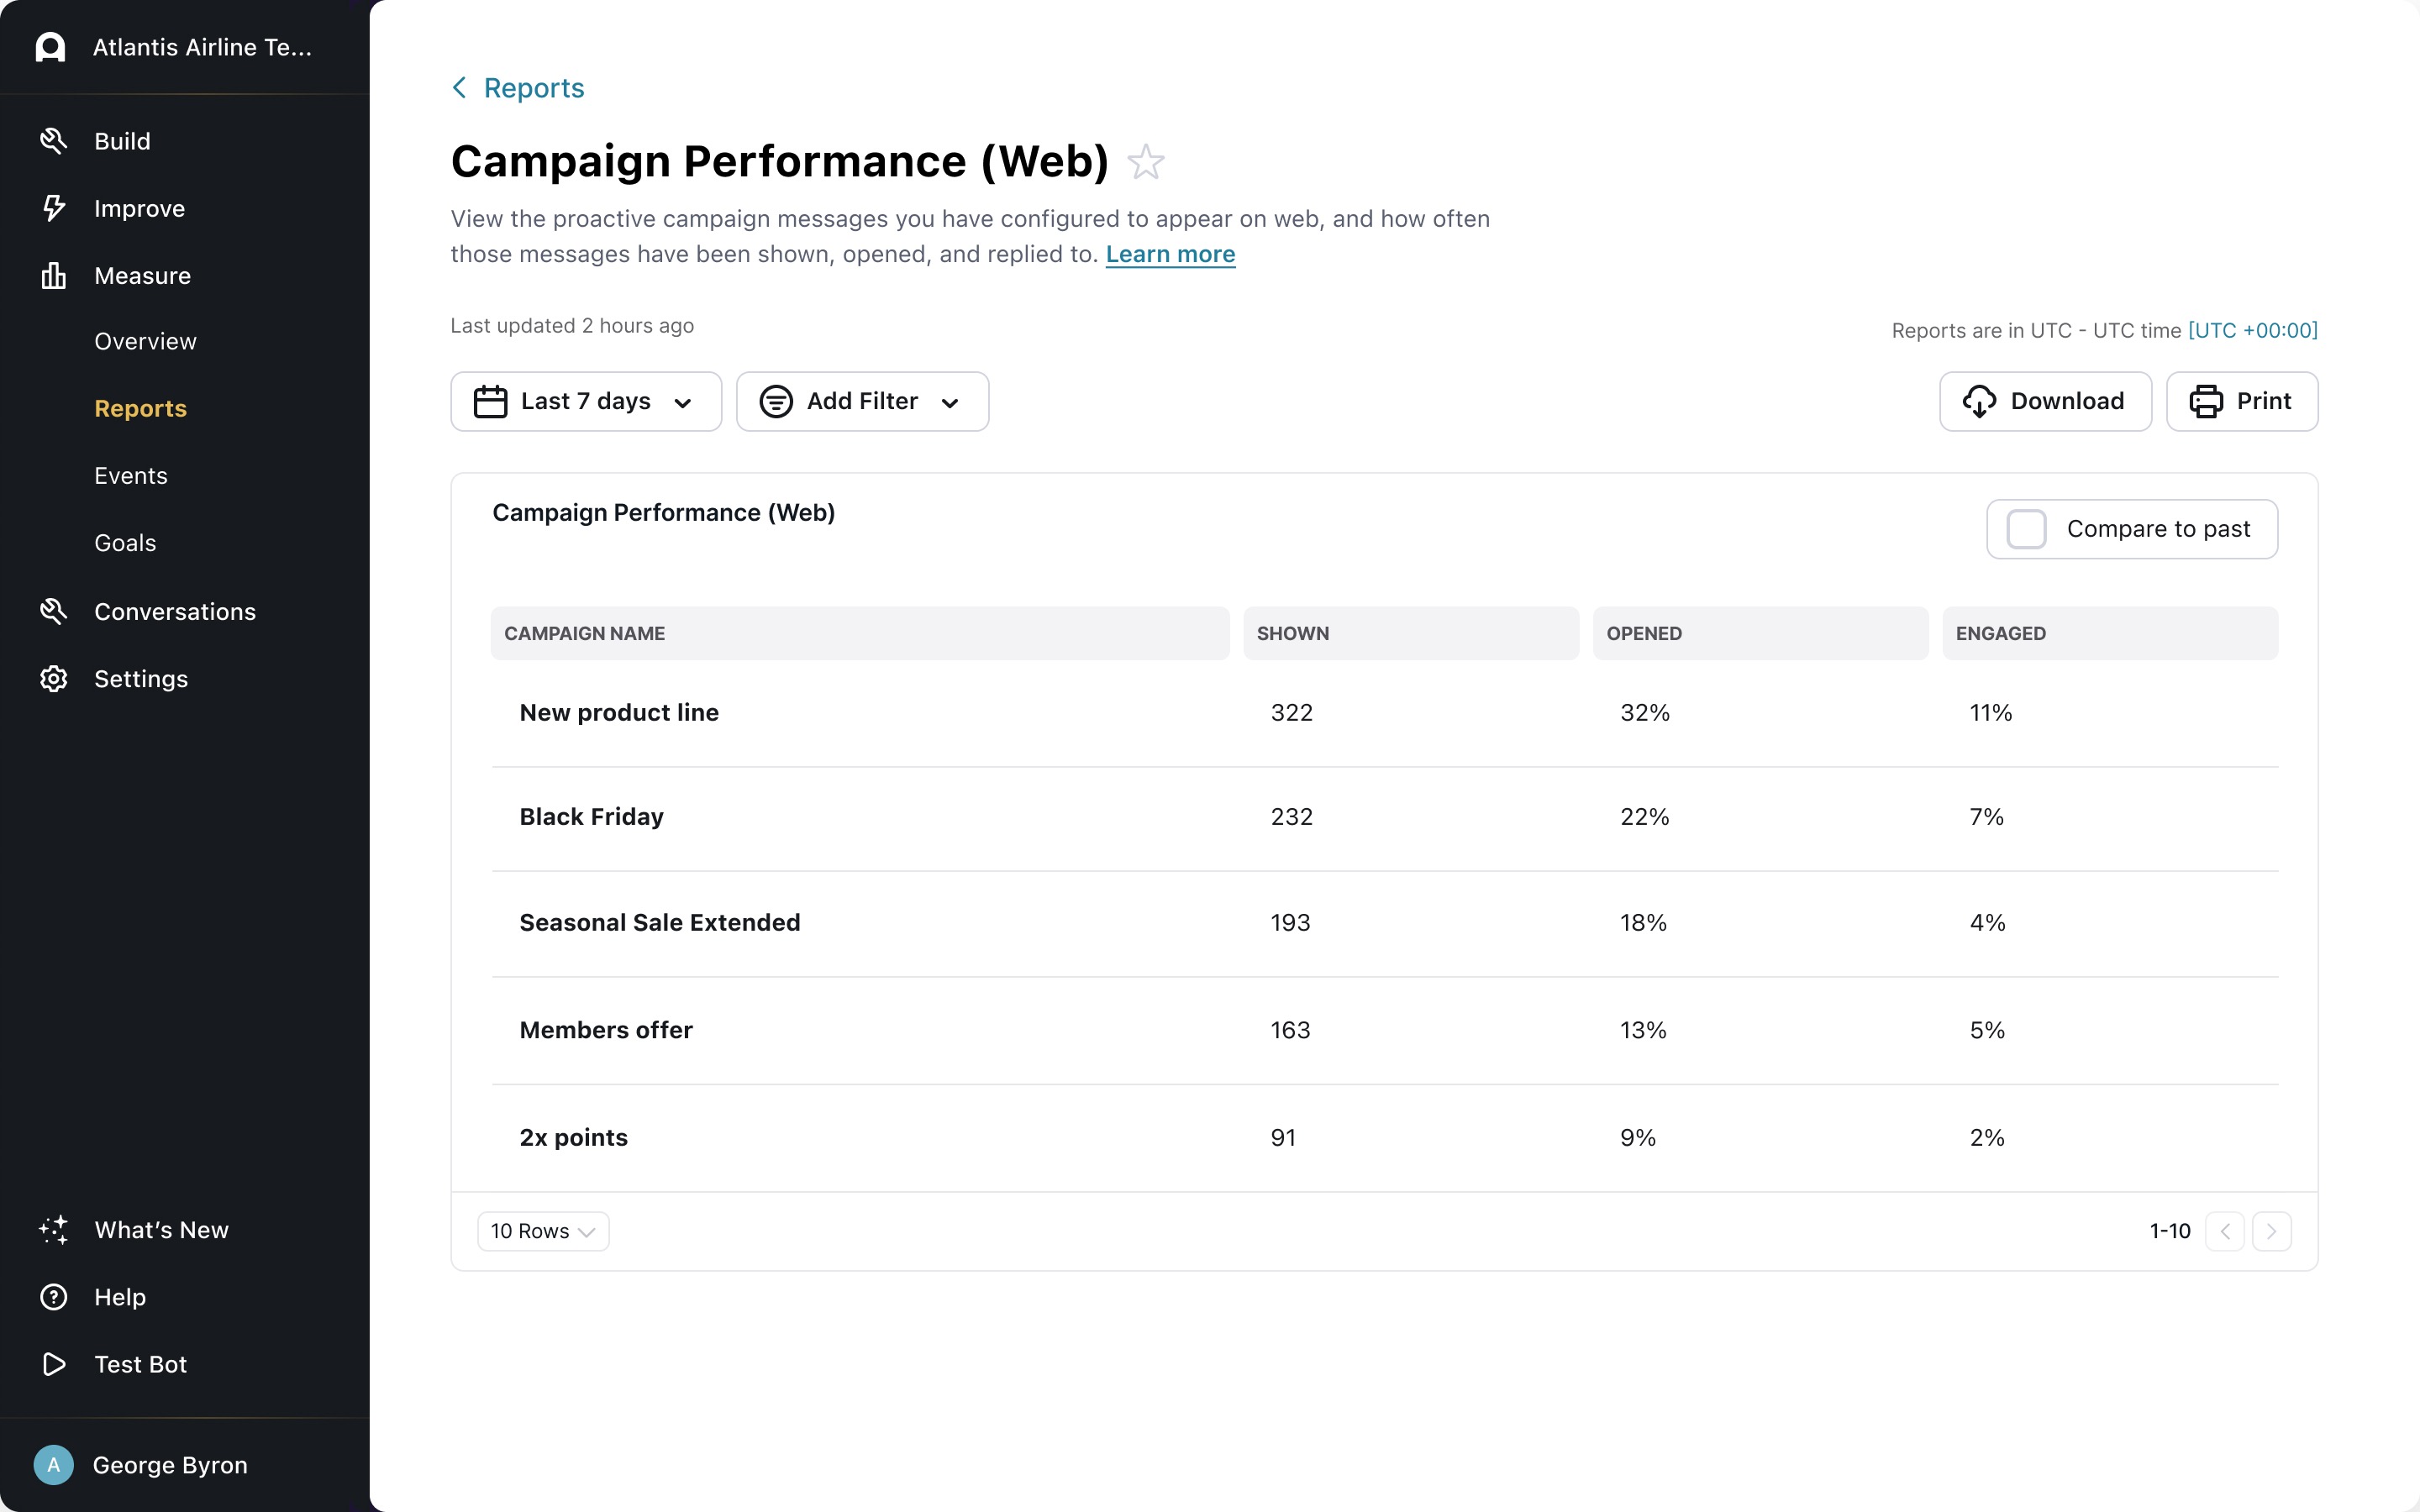
Campaign Performance (Web)
View the proactive campaign messages you have configured to appear on web, and how often those messages have been shown, opened, and replied to. For more information, see Start conversations using basic proactive campaigns and Start customizable interactions using advanced proactive campaigns.
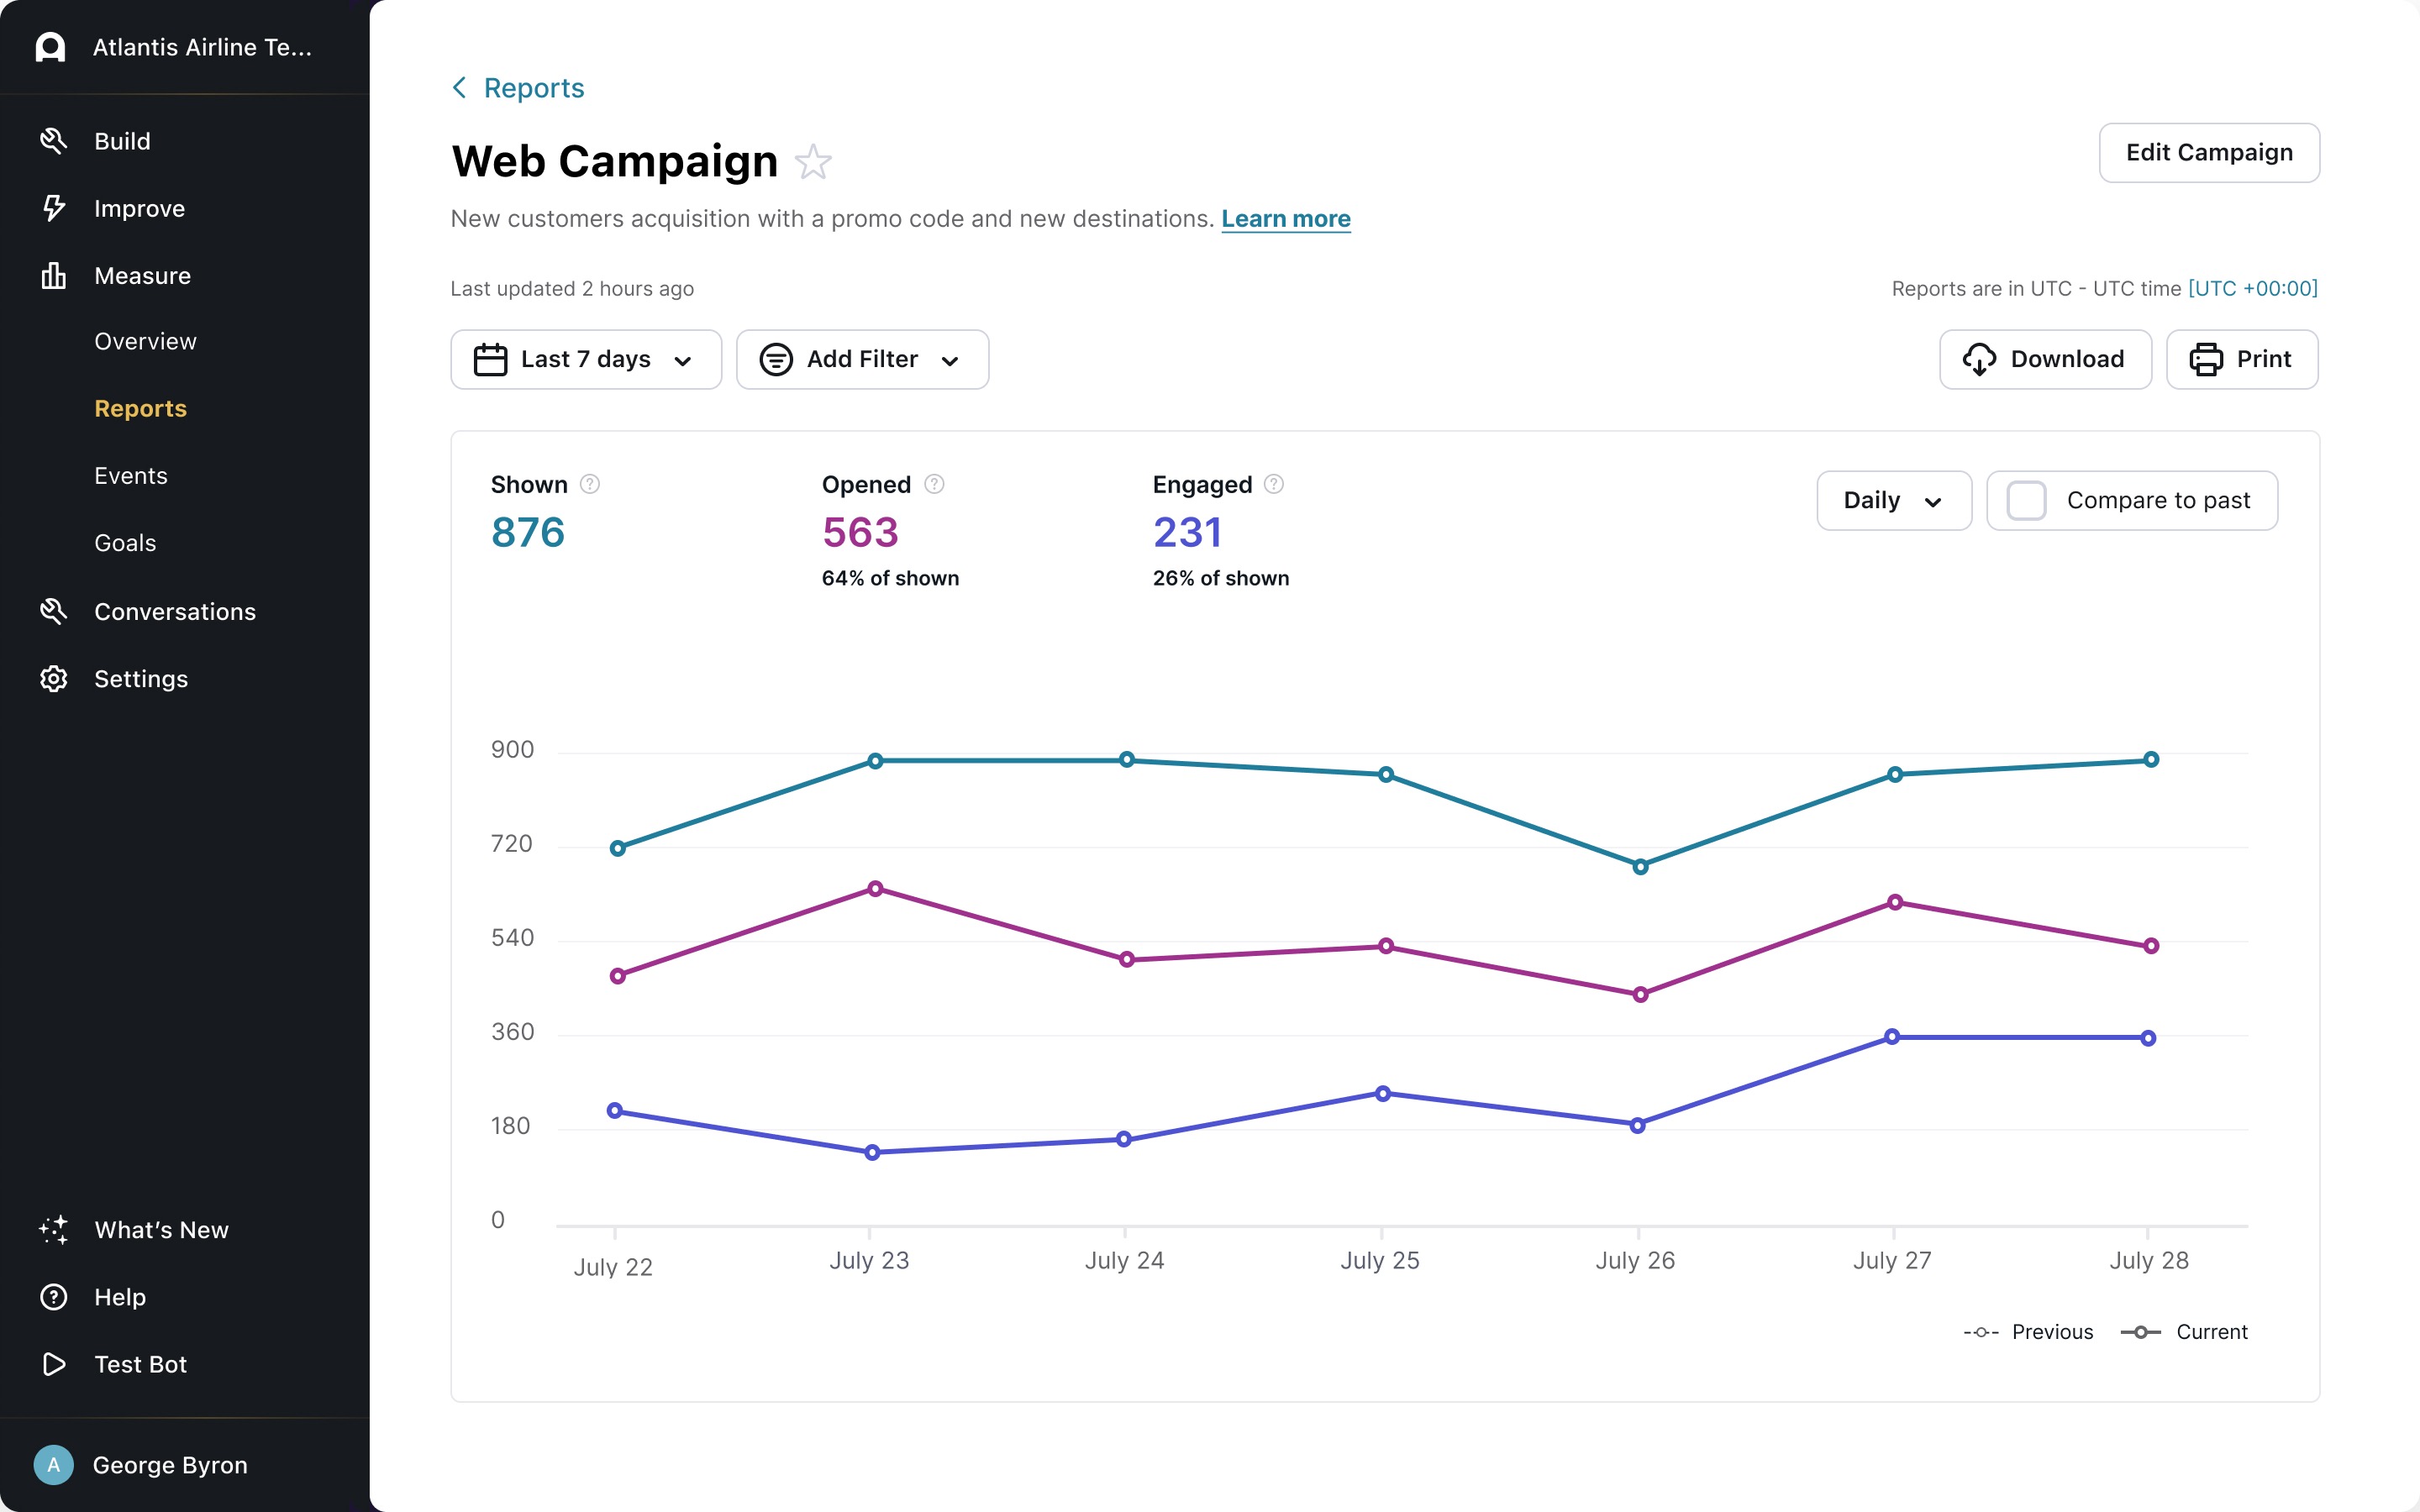
Campaign Breakdown (Web)
View how a specific web campaign has performed. For more information, see Start conversations using basic proactive campaigns and Start customizable interactions using advanced proactive campaigns.
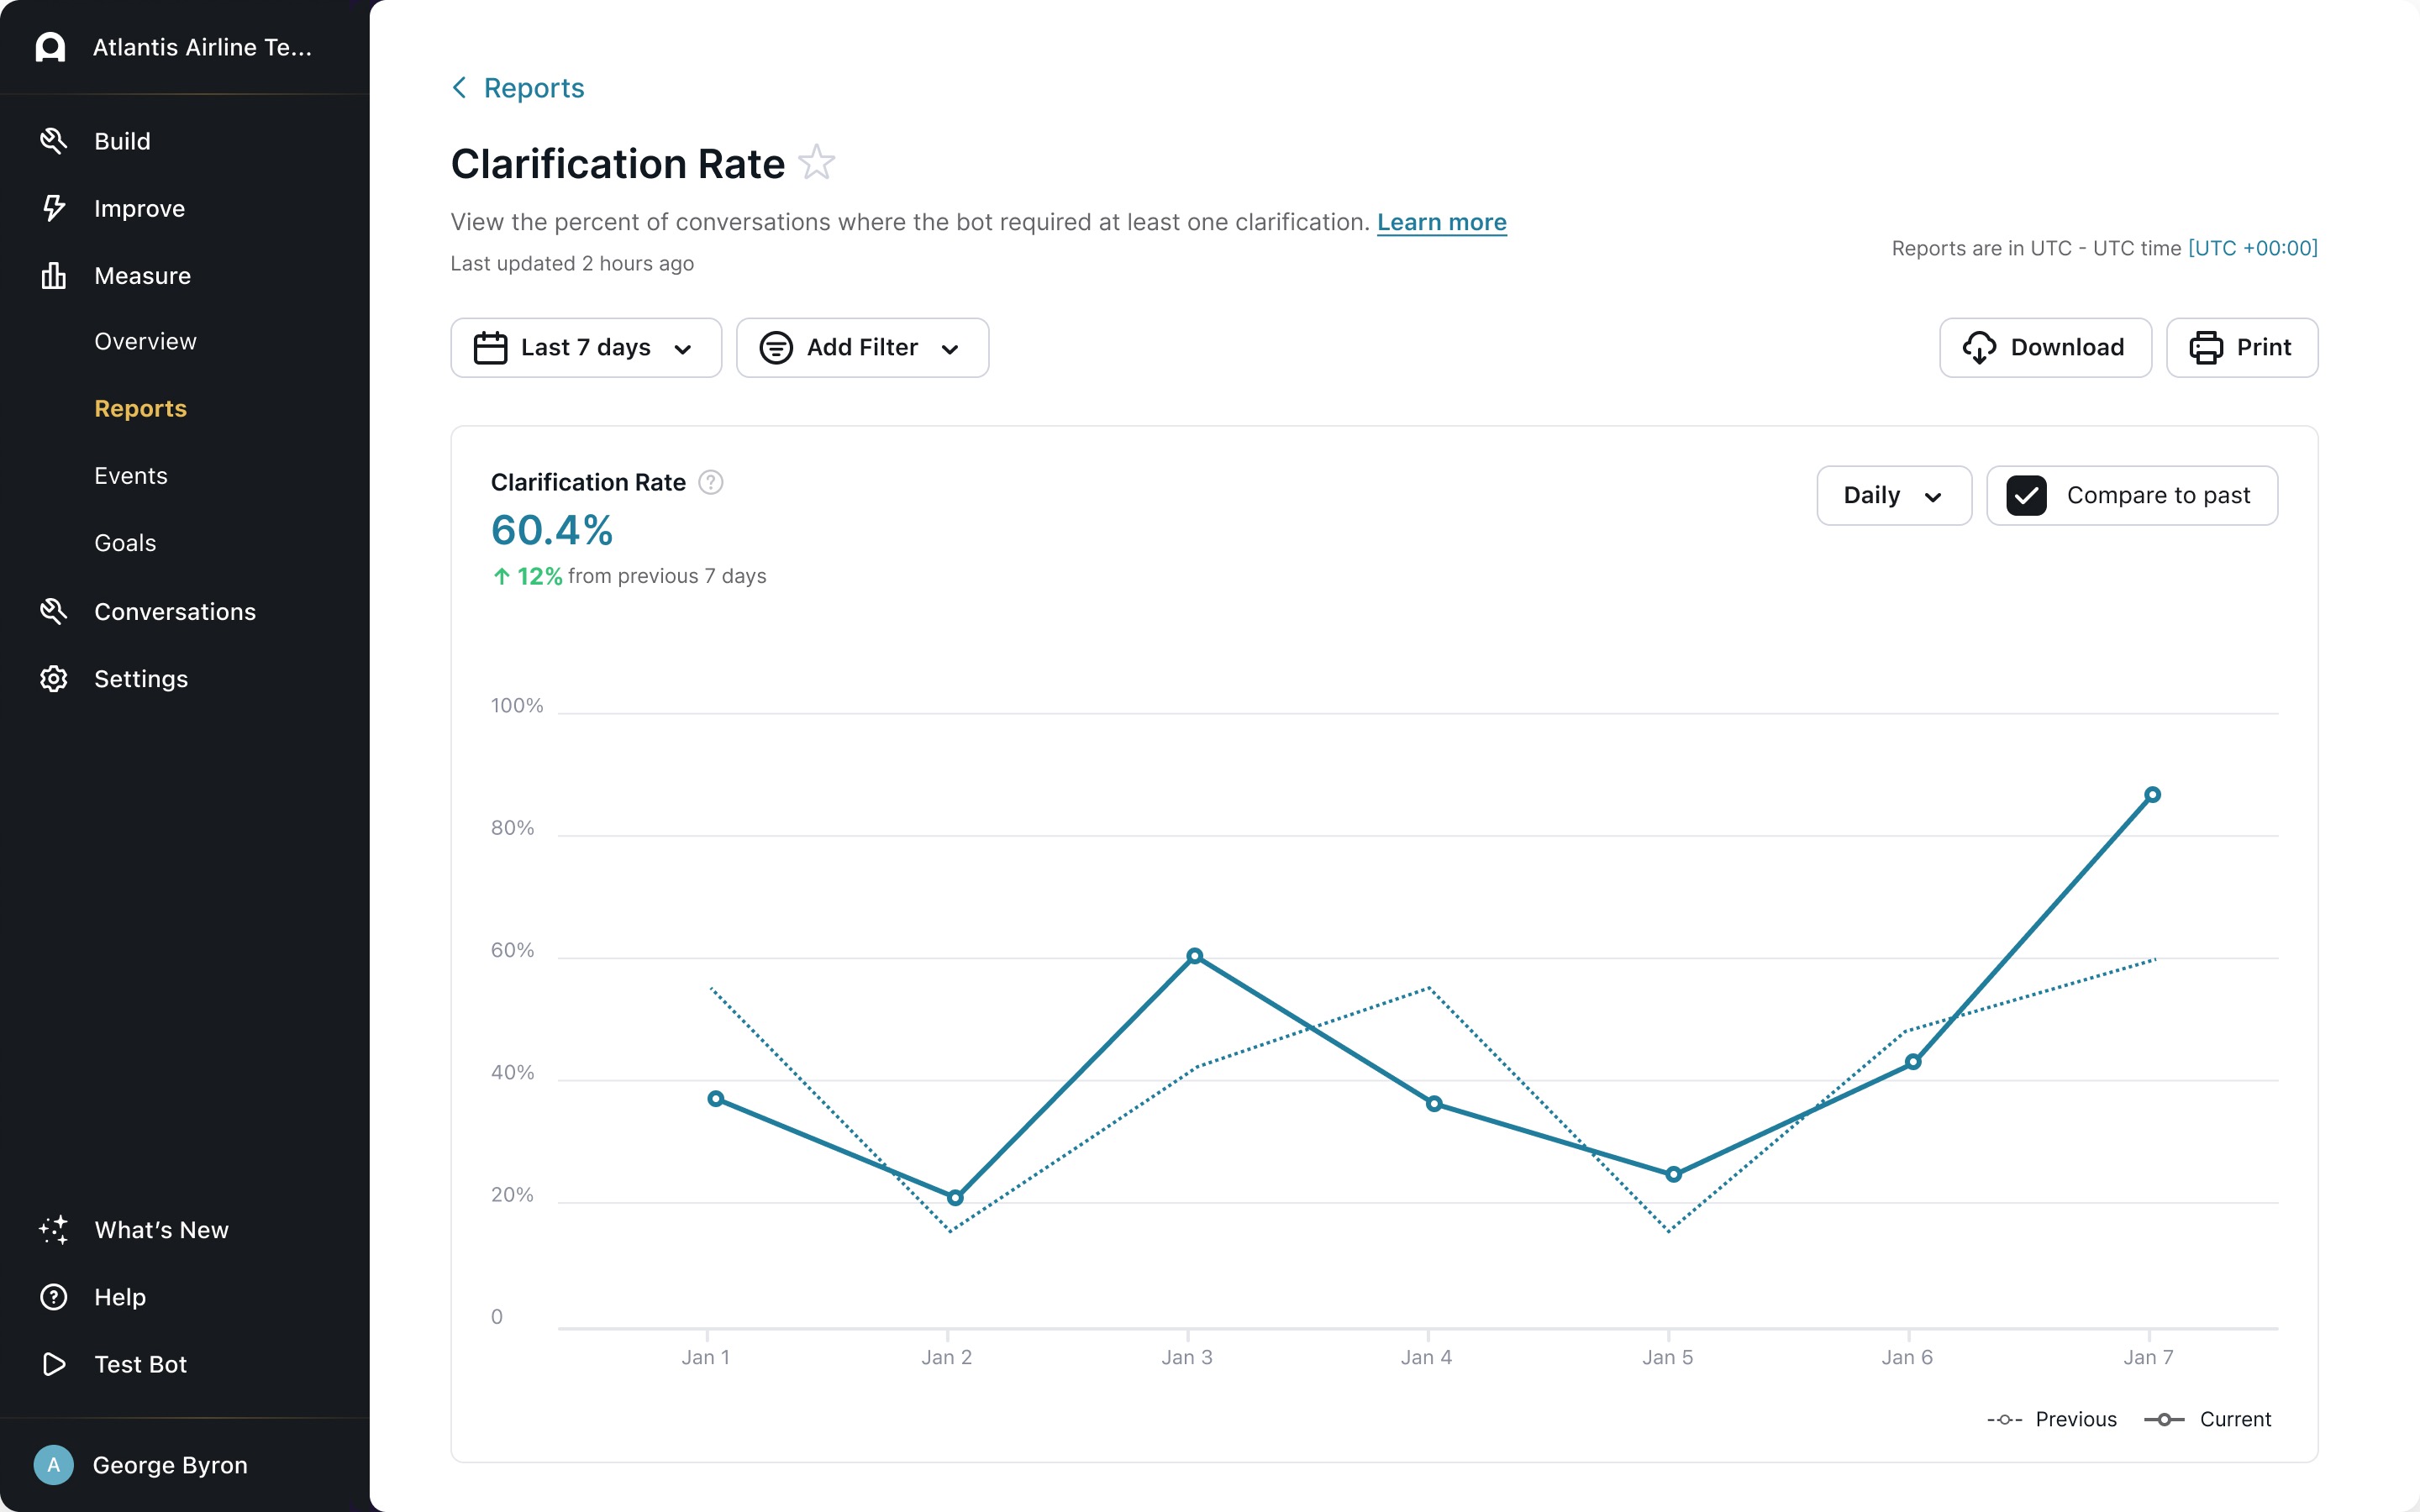
Clarification Rate
View the percent of conversations where your bot required at least one clarification. For more information, see Understand the Needs Clarification and Not Understood Answers.
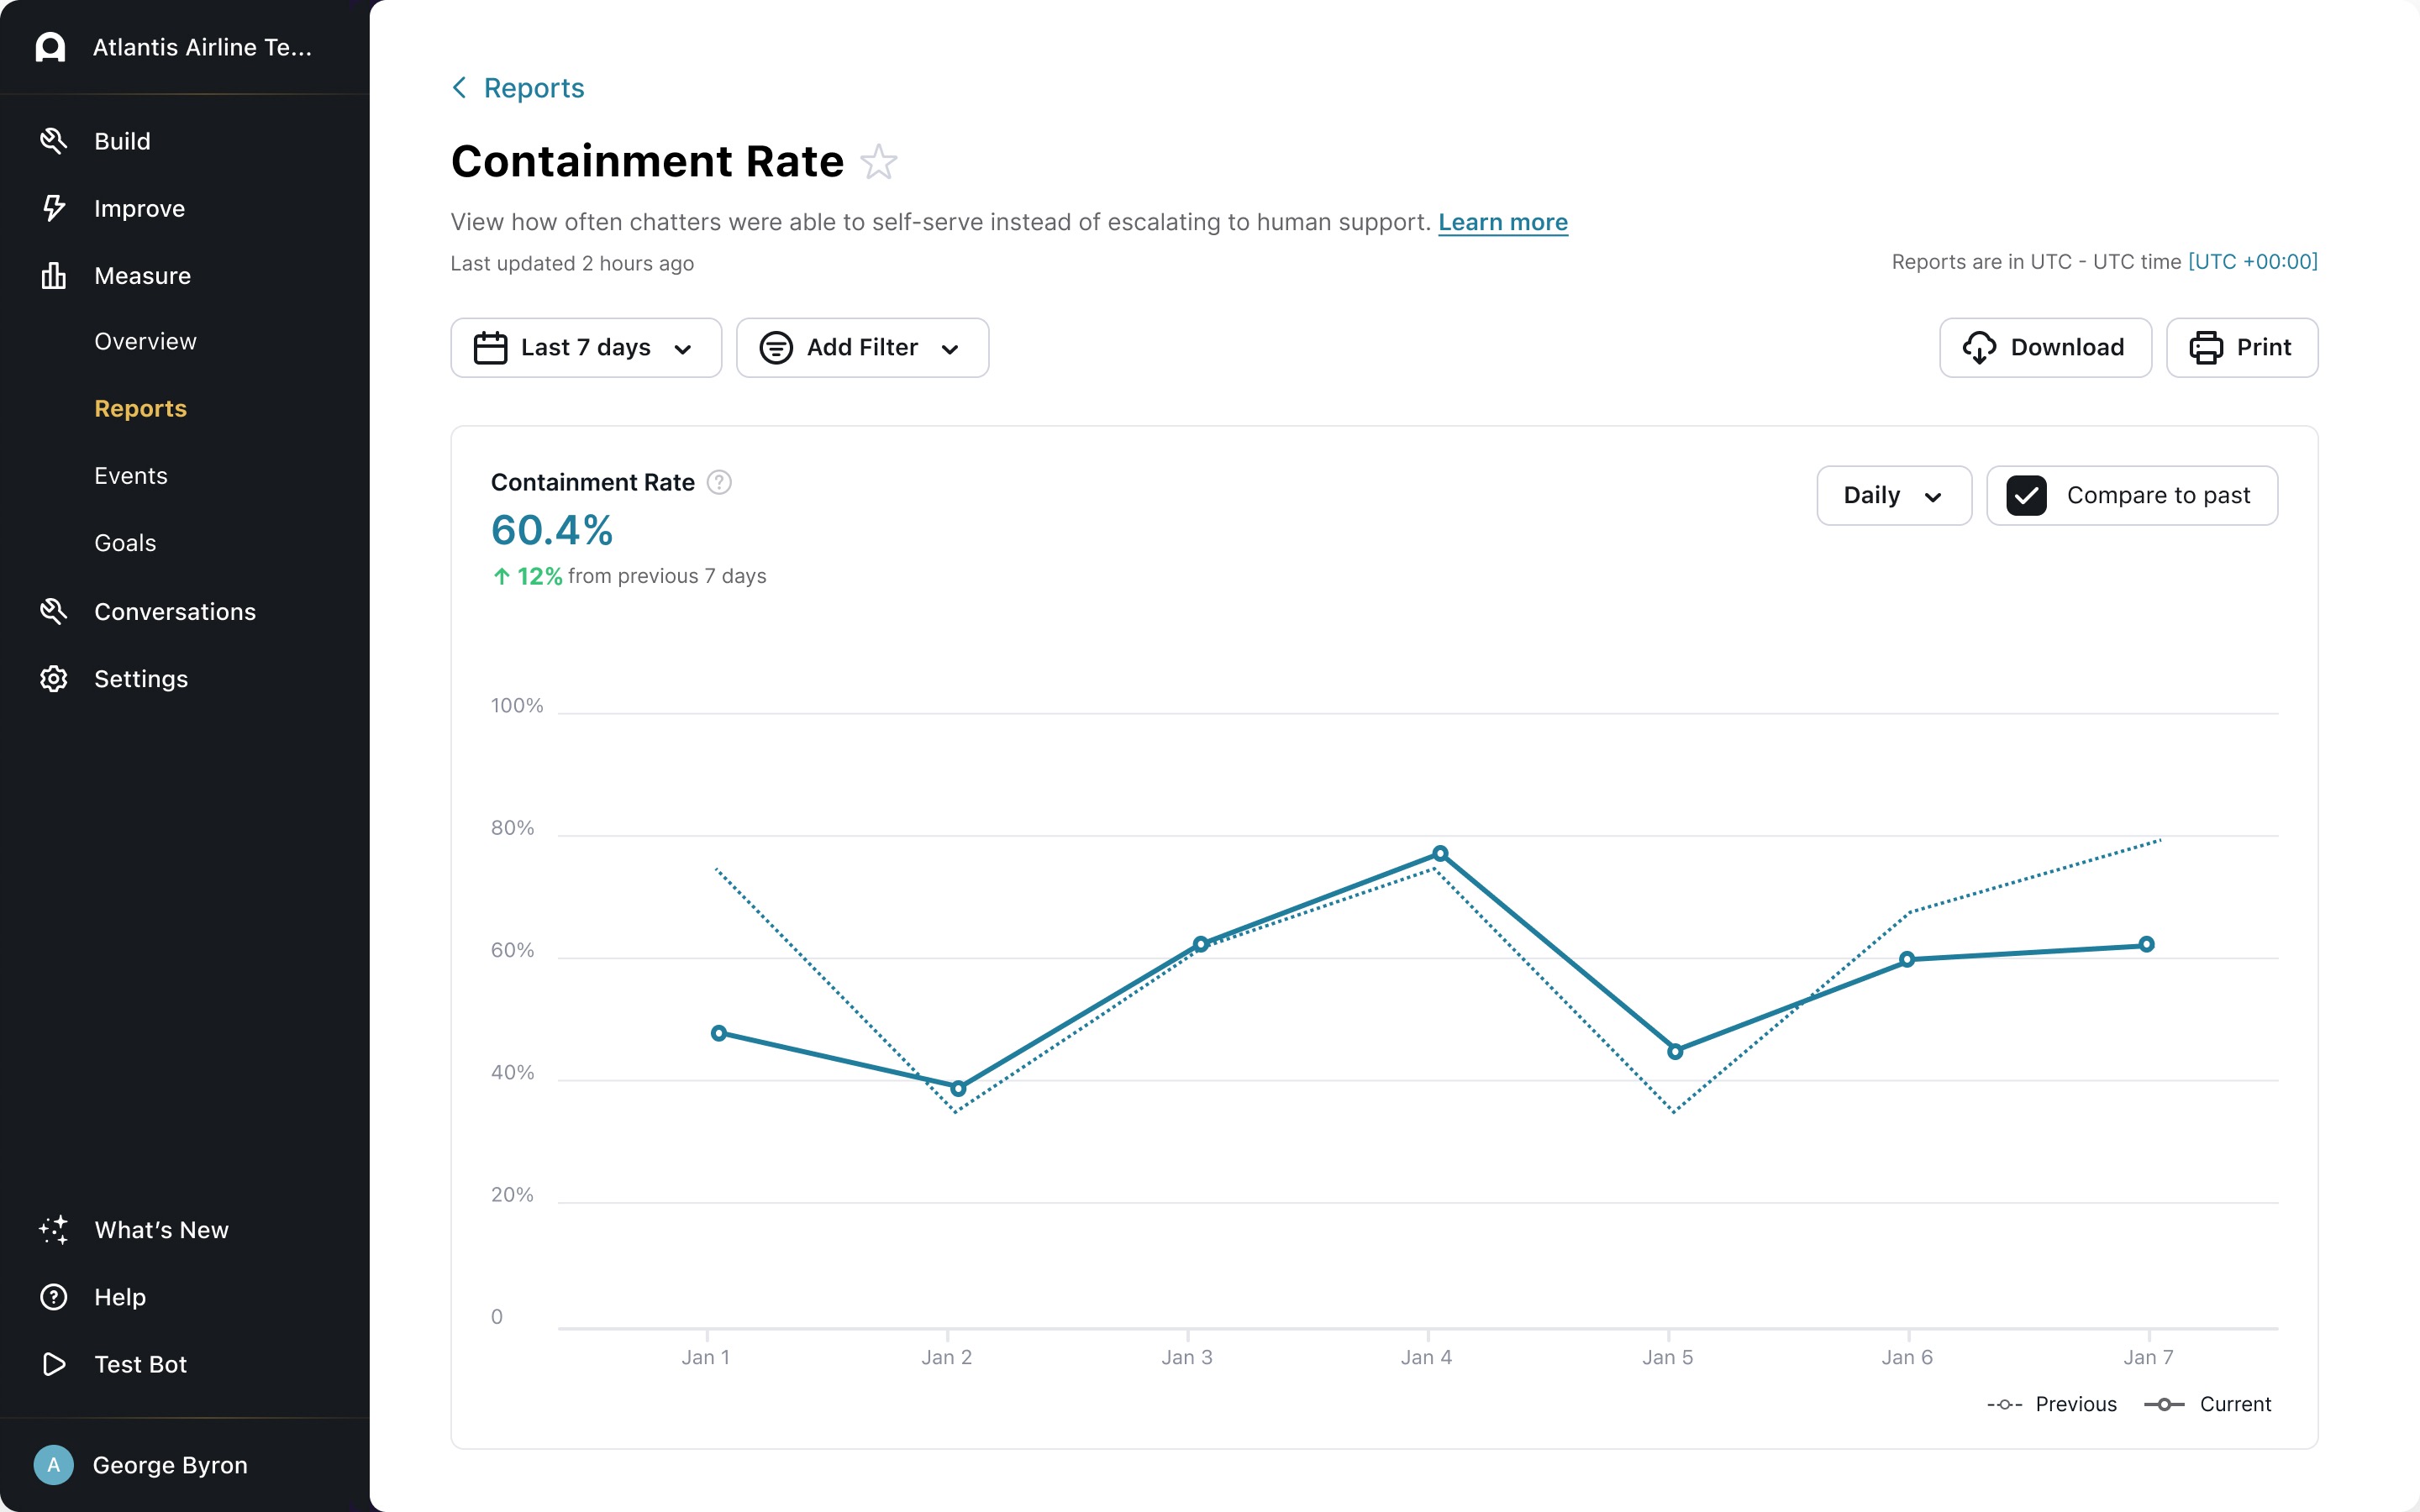
Containment Rate
View how often chatters were able to self-serve instead of escalating to human support.
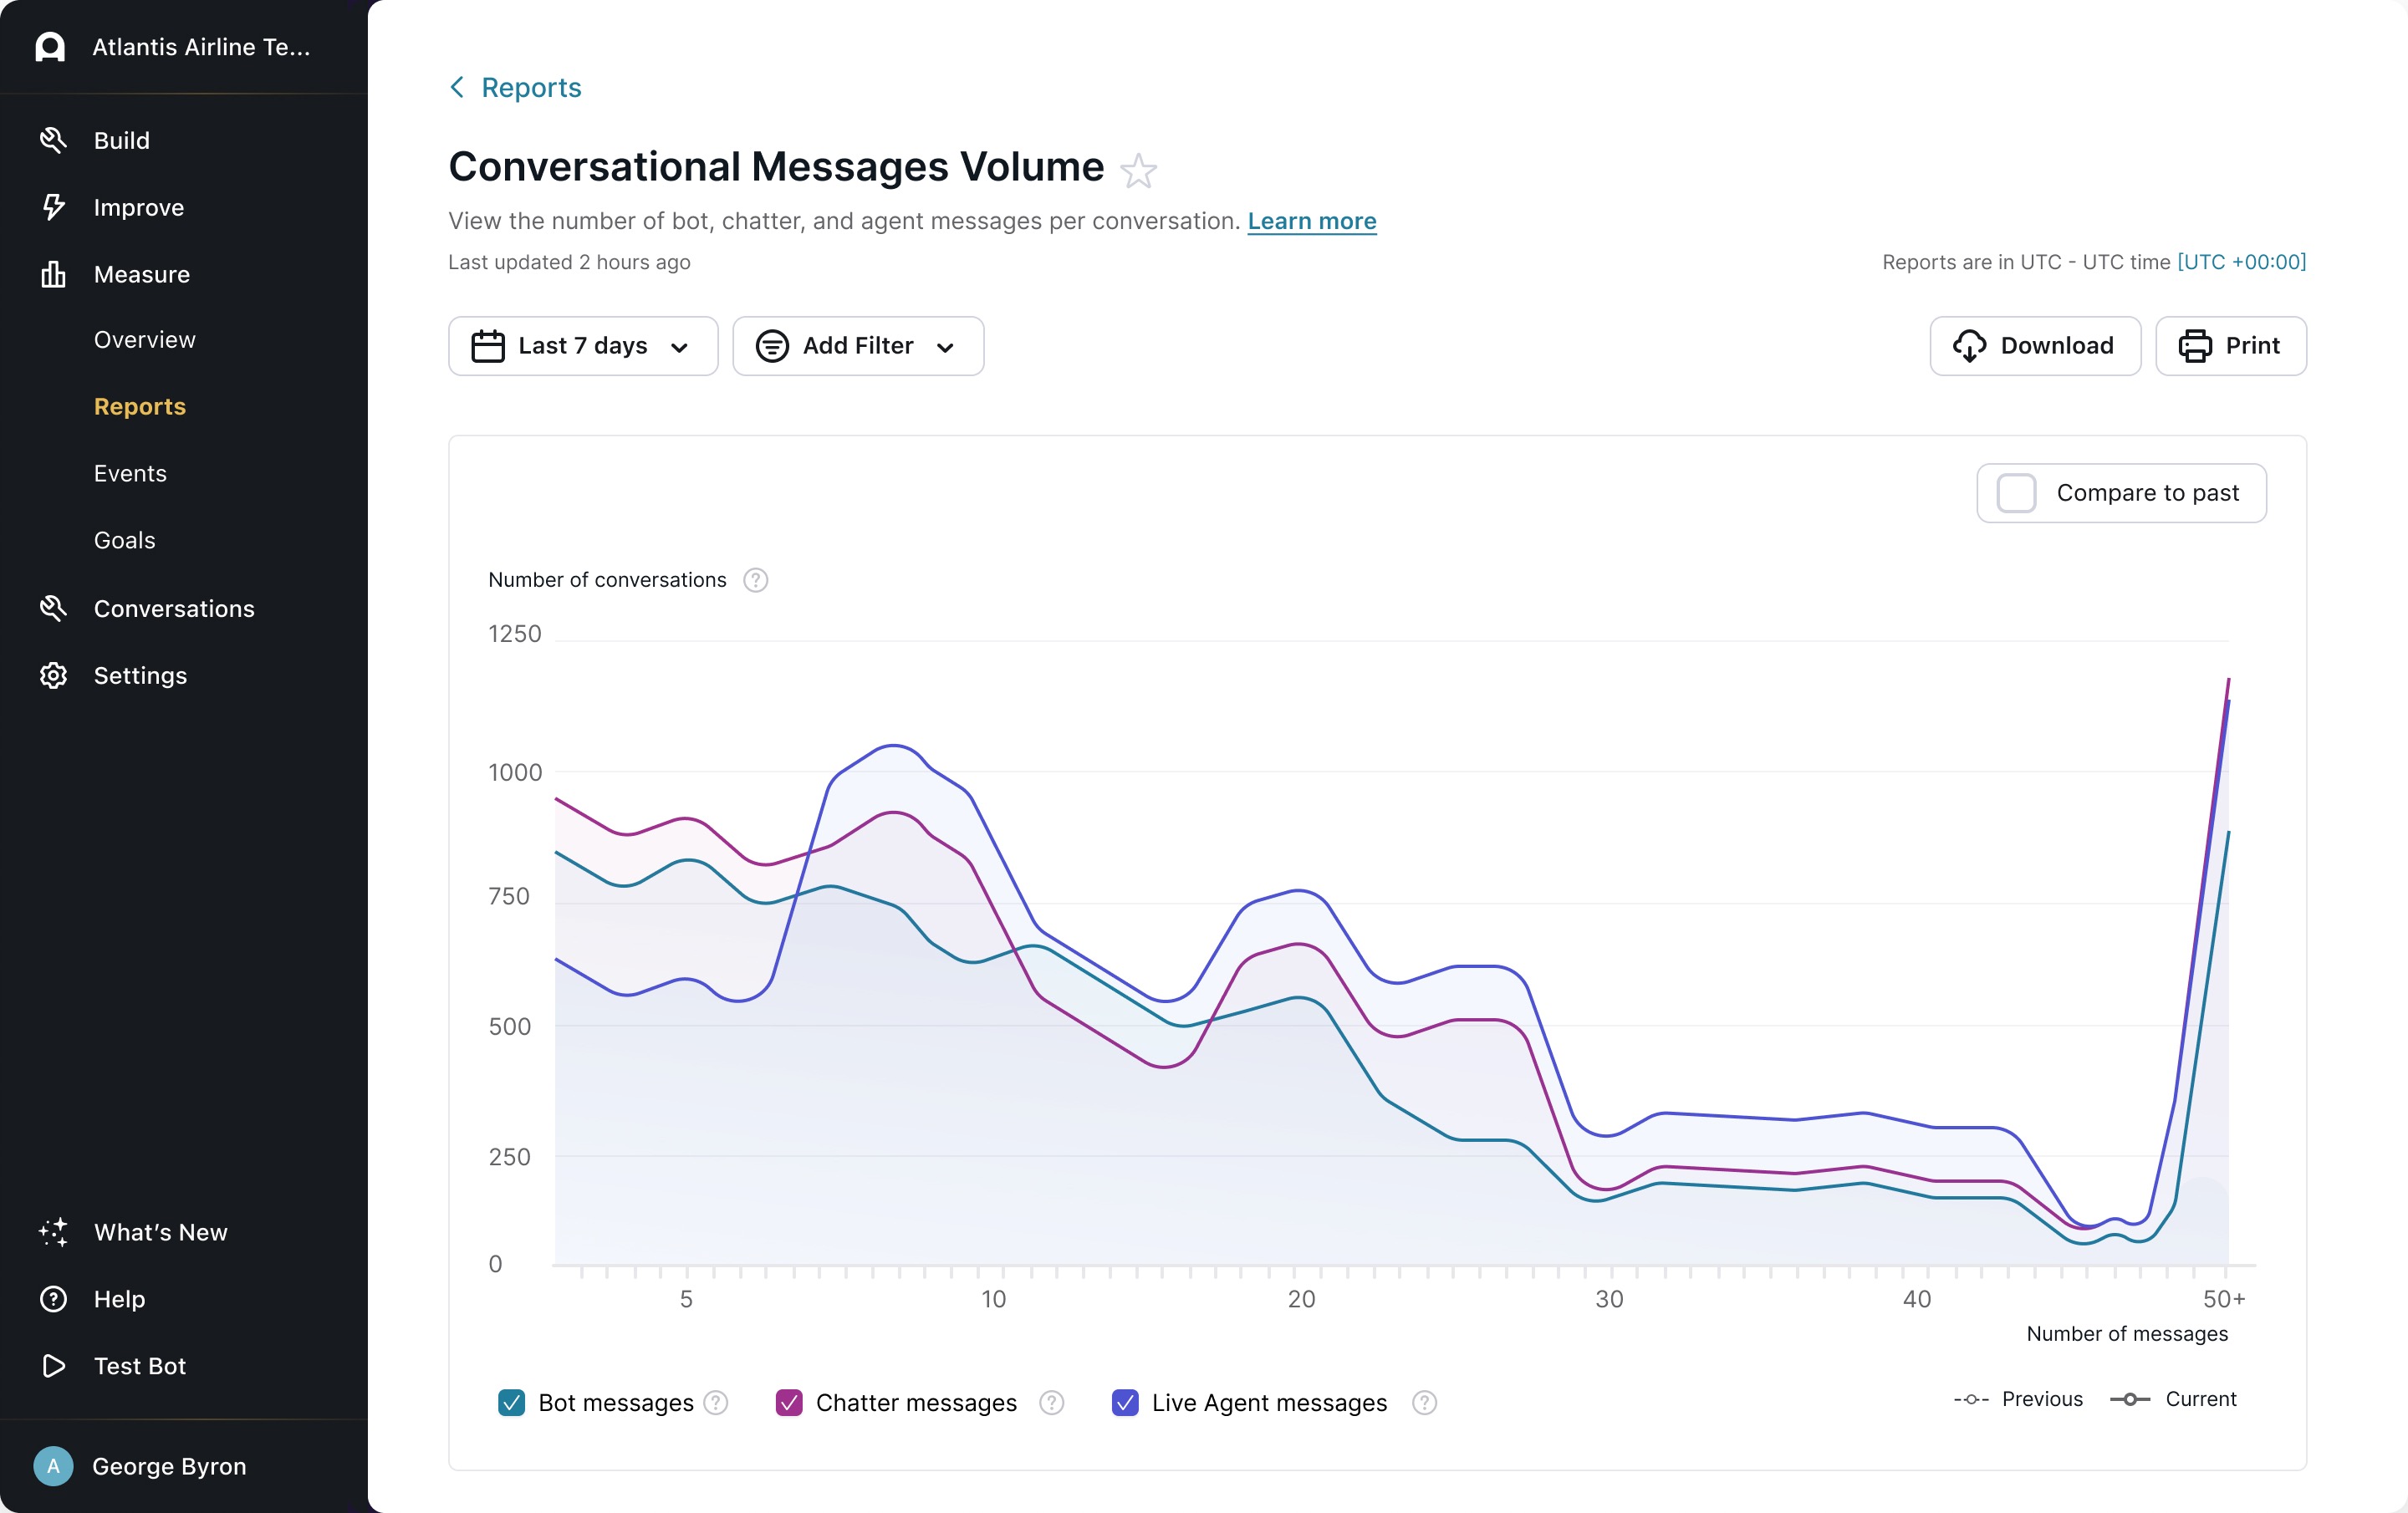
Conversational Messages Volume
View the number of bot, chatter, and agent messages per conversation.
Example conversation:
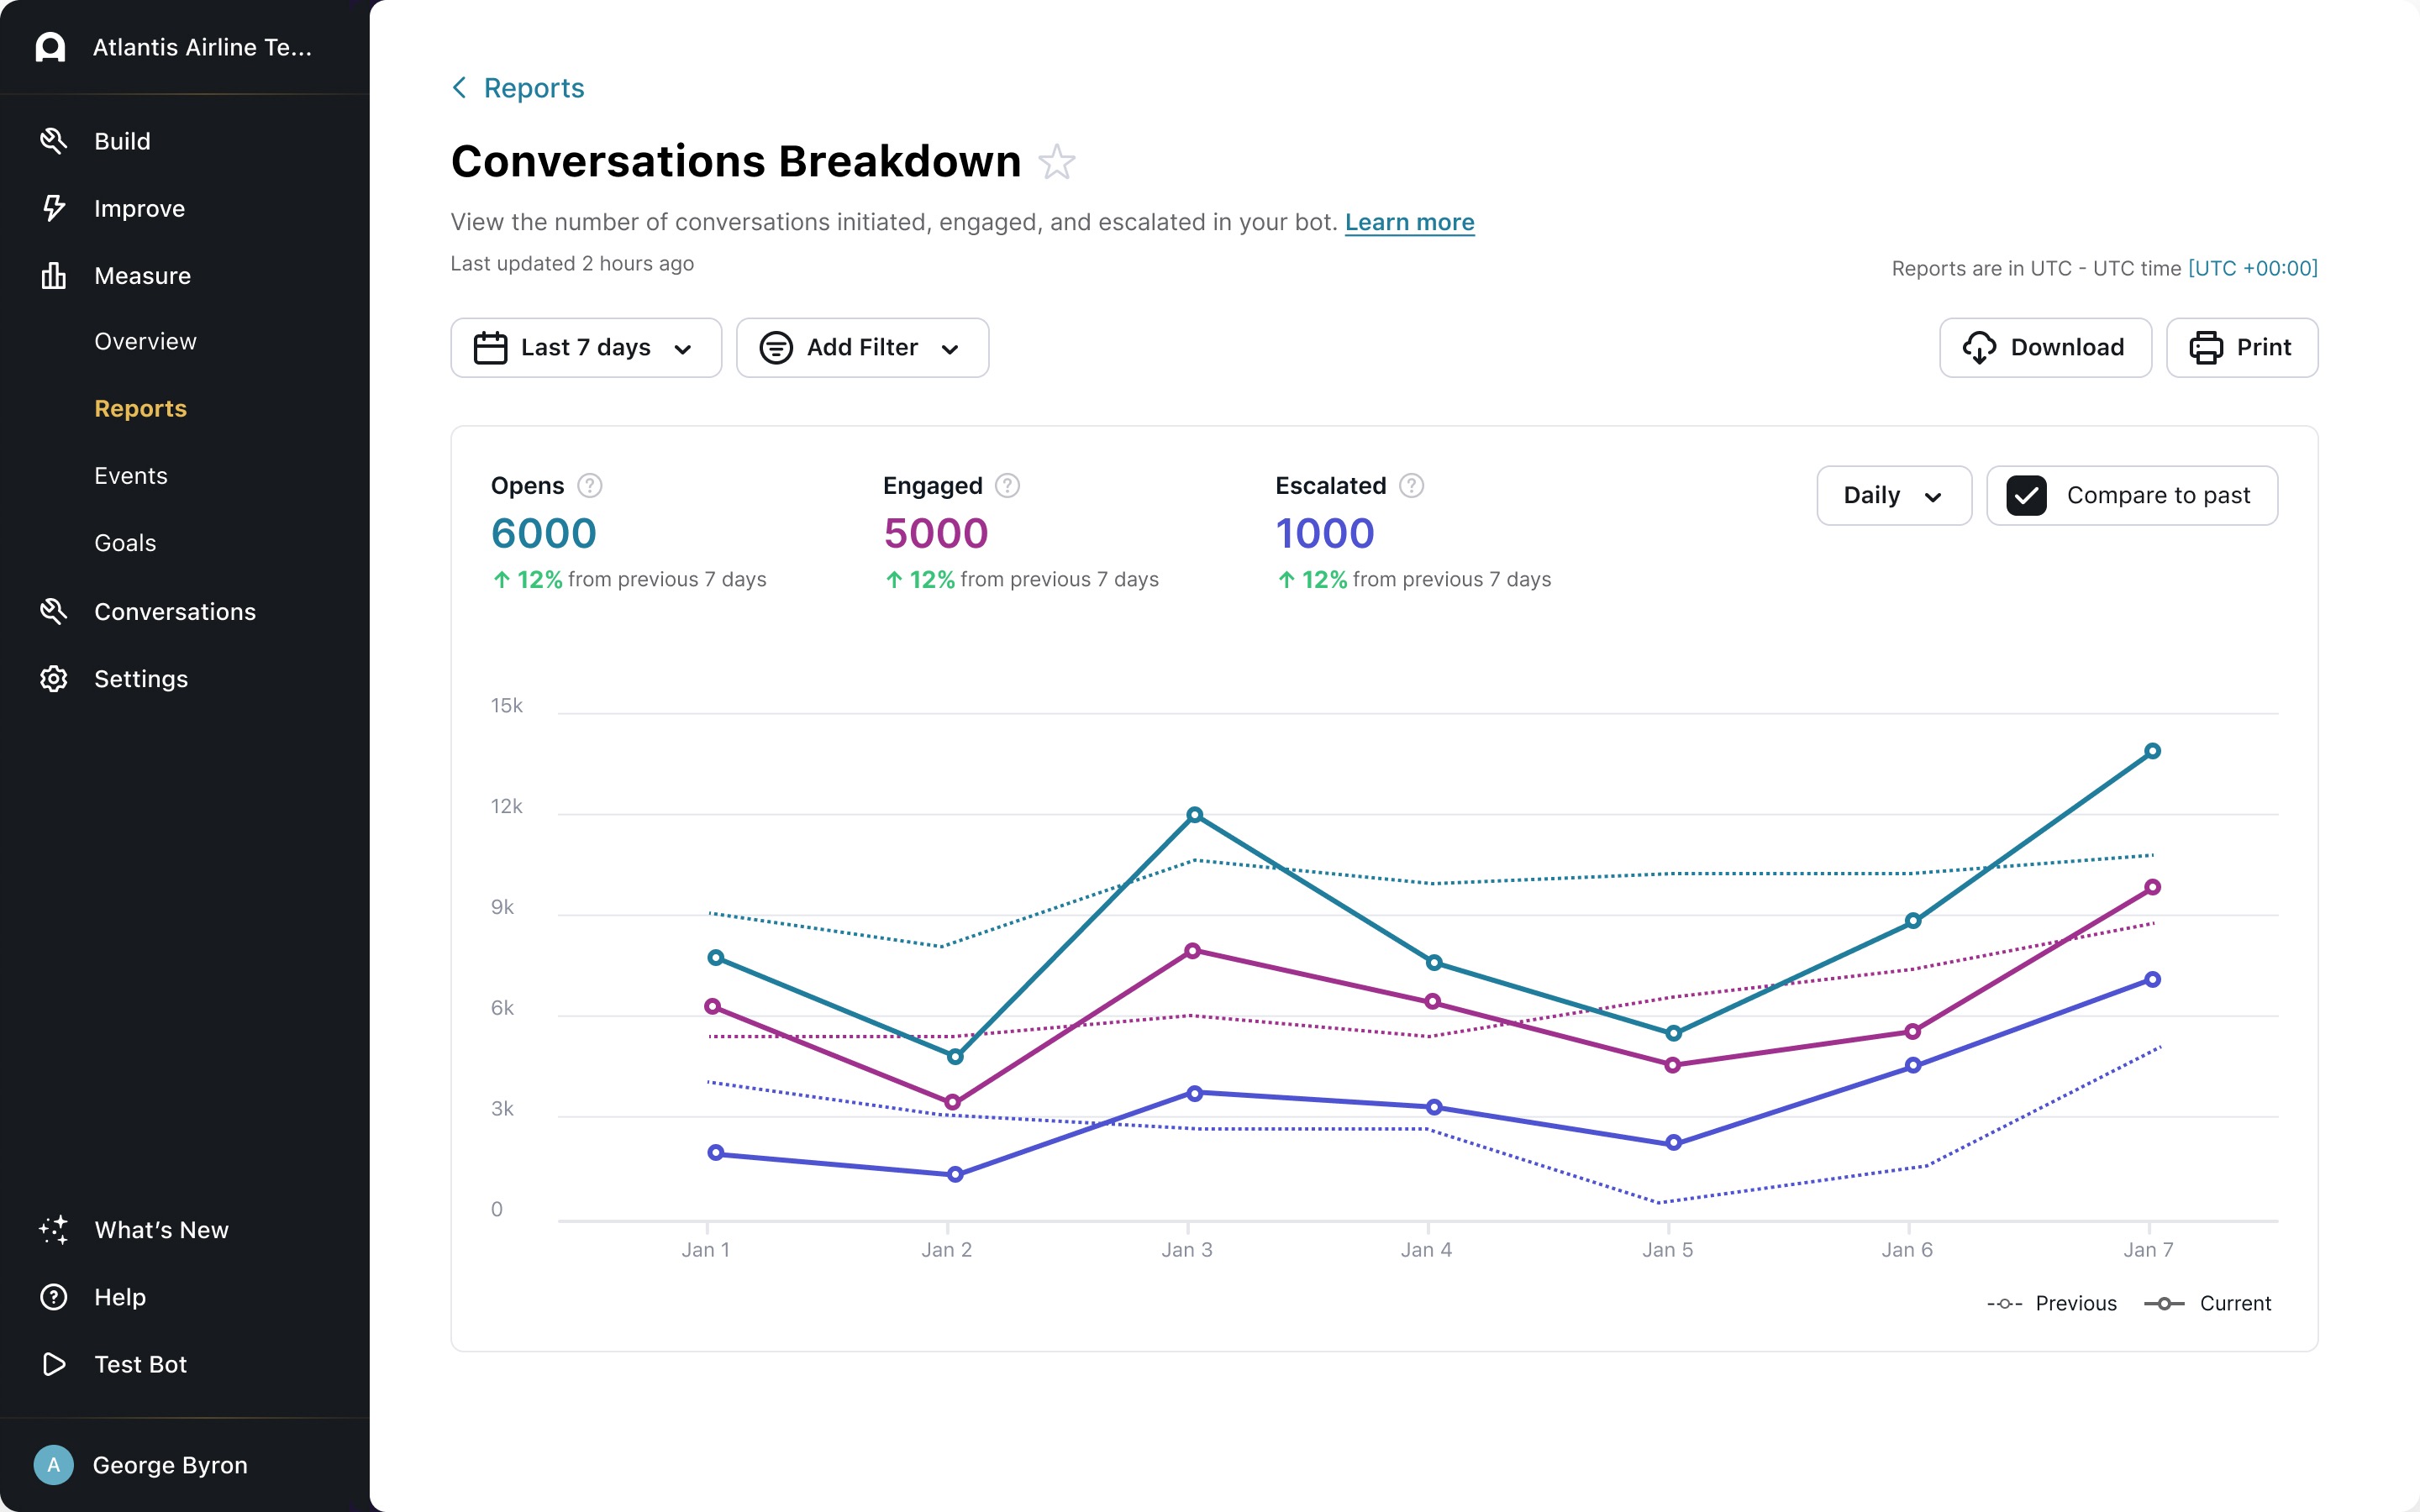
Conversations Breakdown
View the number of conversations initiated, engaged, and escalated in your bot.
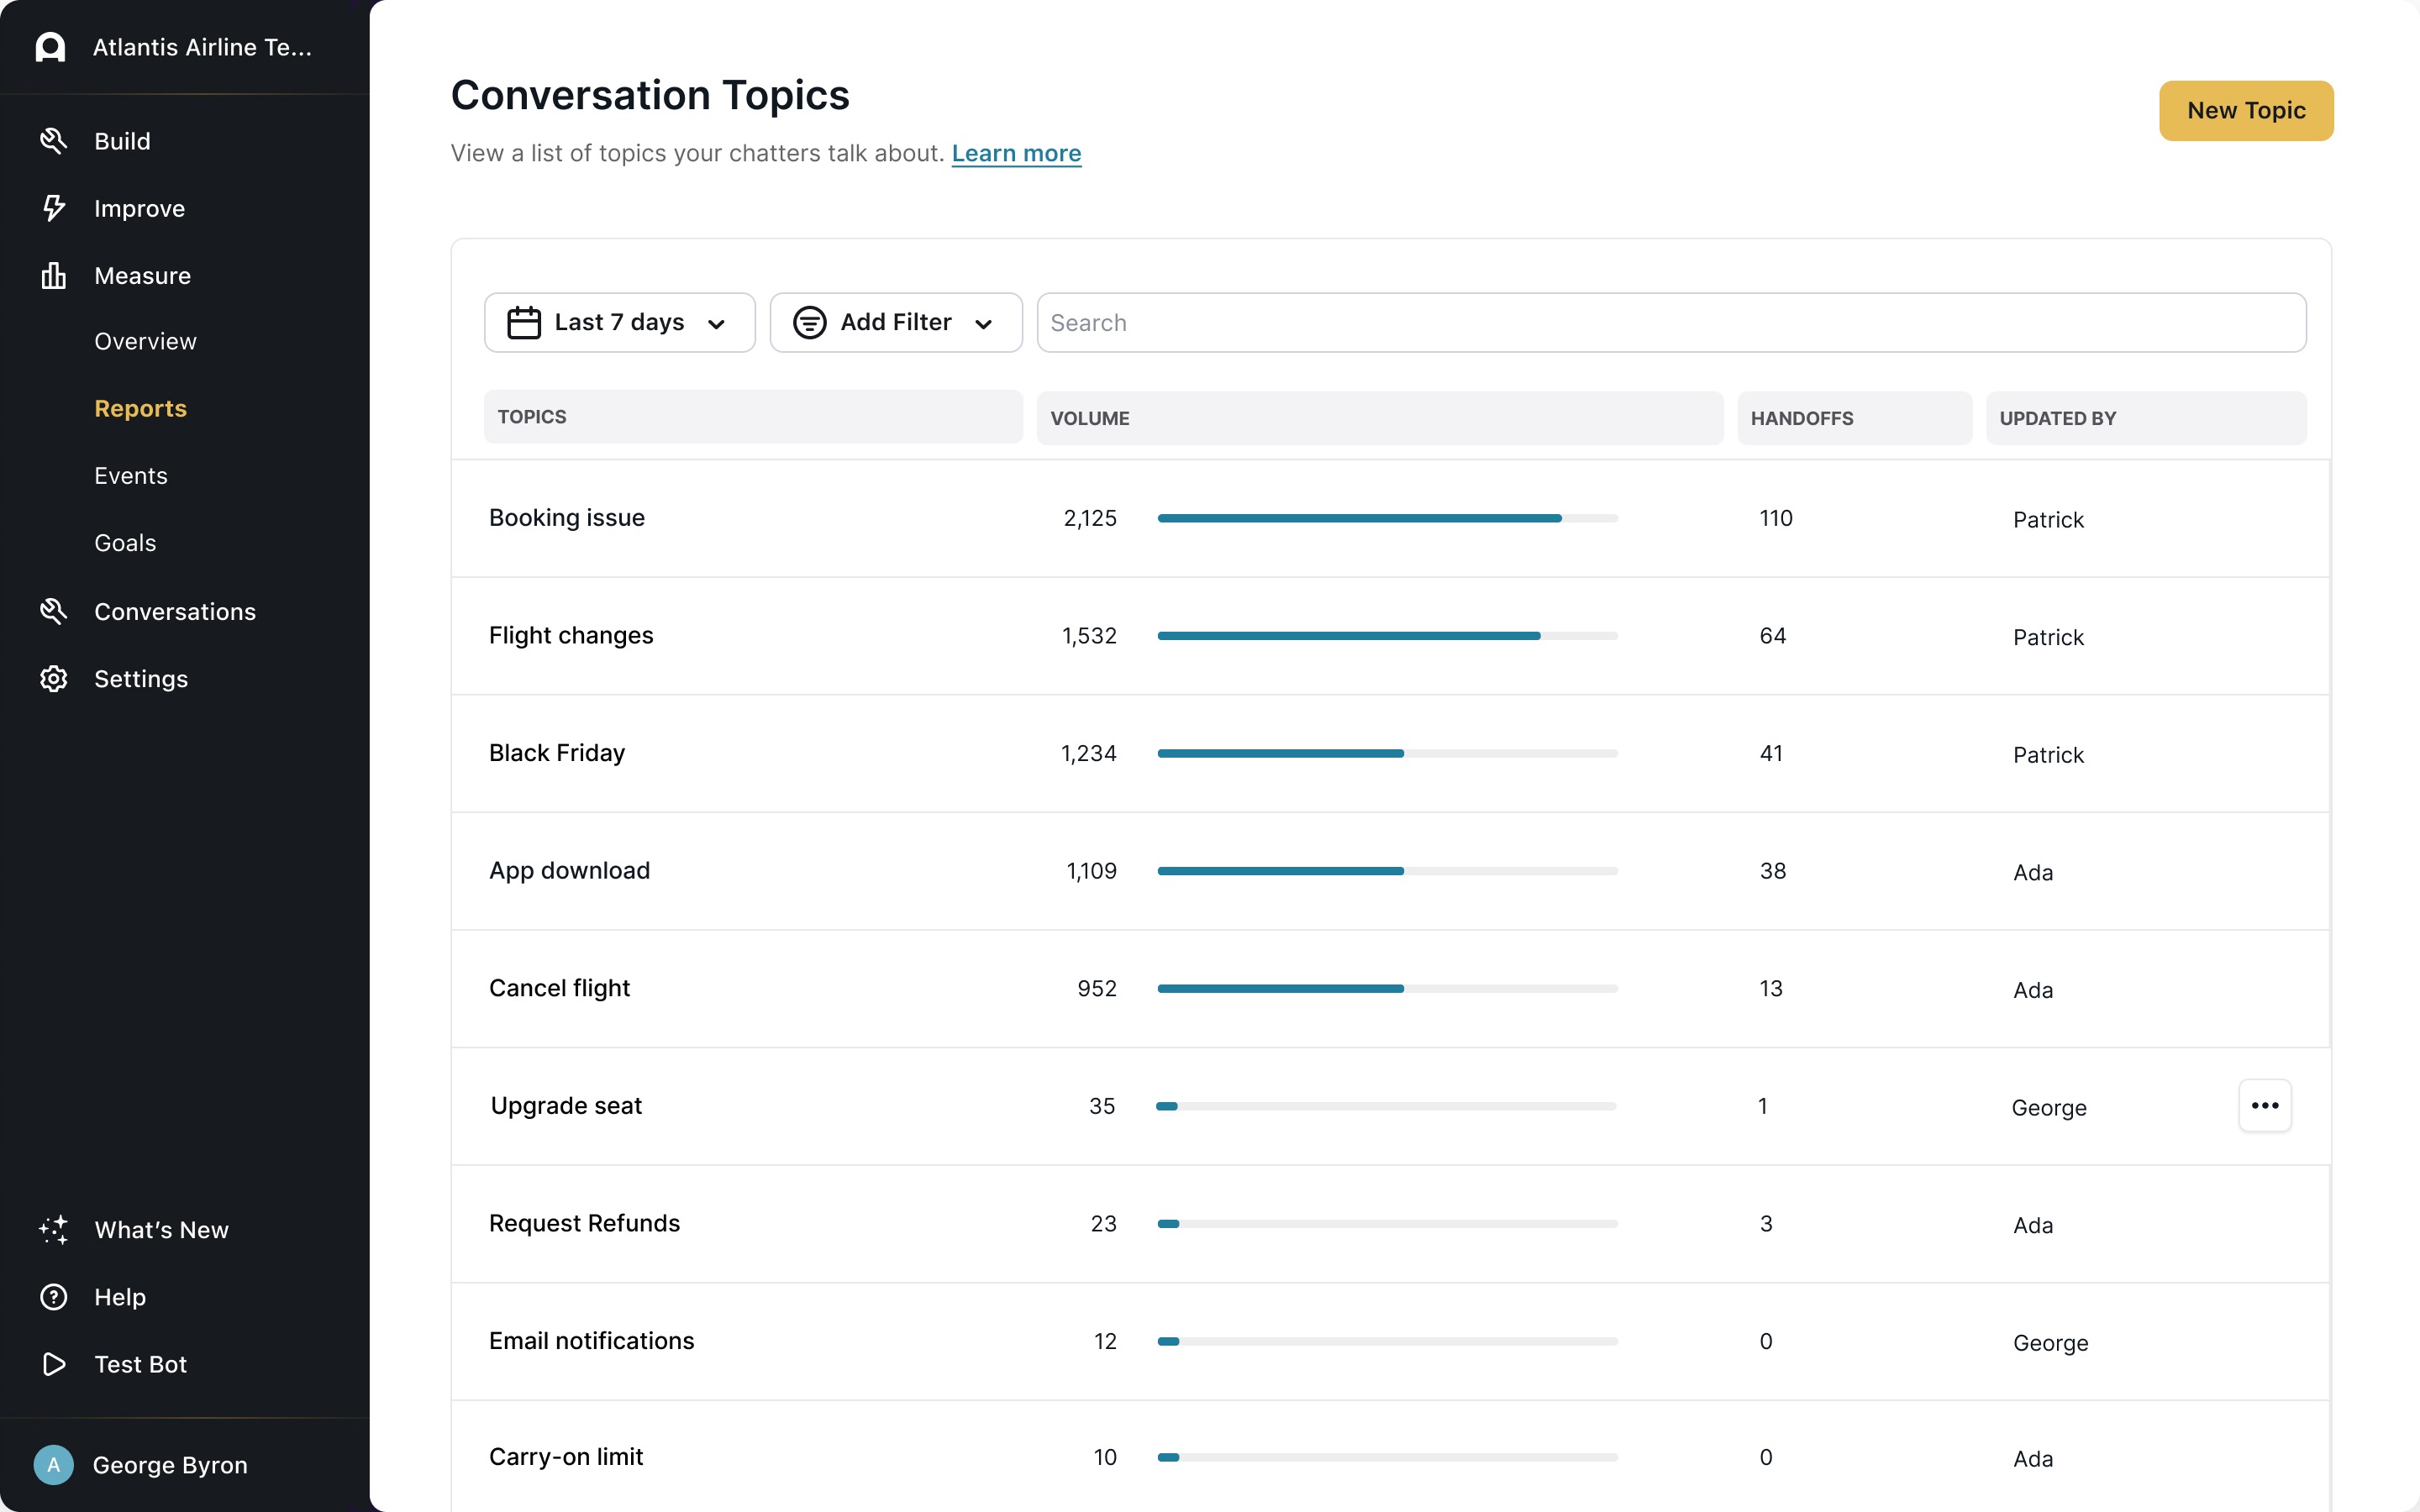
Conversation Topics Overview
View a list of topics your chatters talk about. For more information, see Track conversation topics.
This report isn’t listed with the other reports; instead, you can see it if you go to Conversations > Topics in your Ada dashboard.
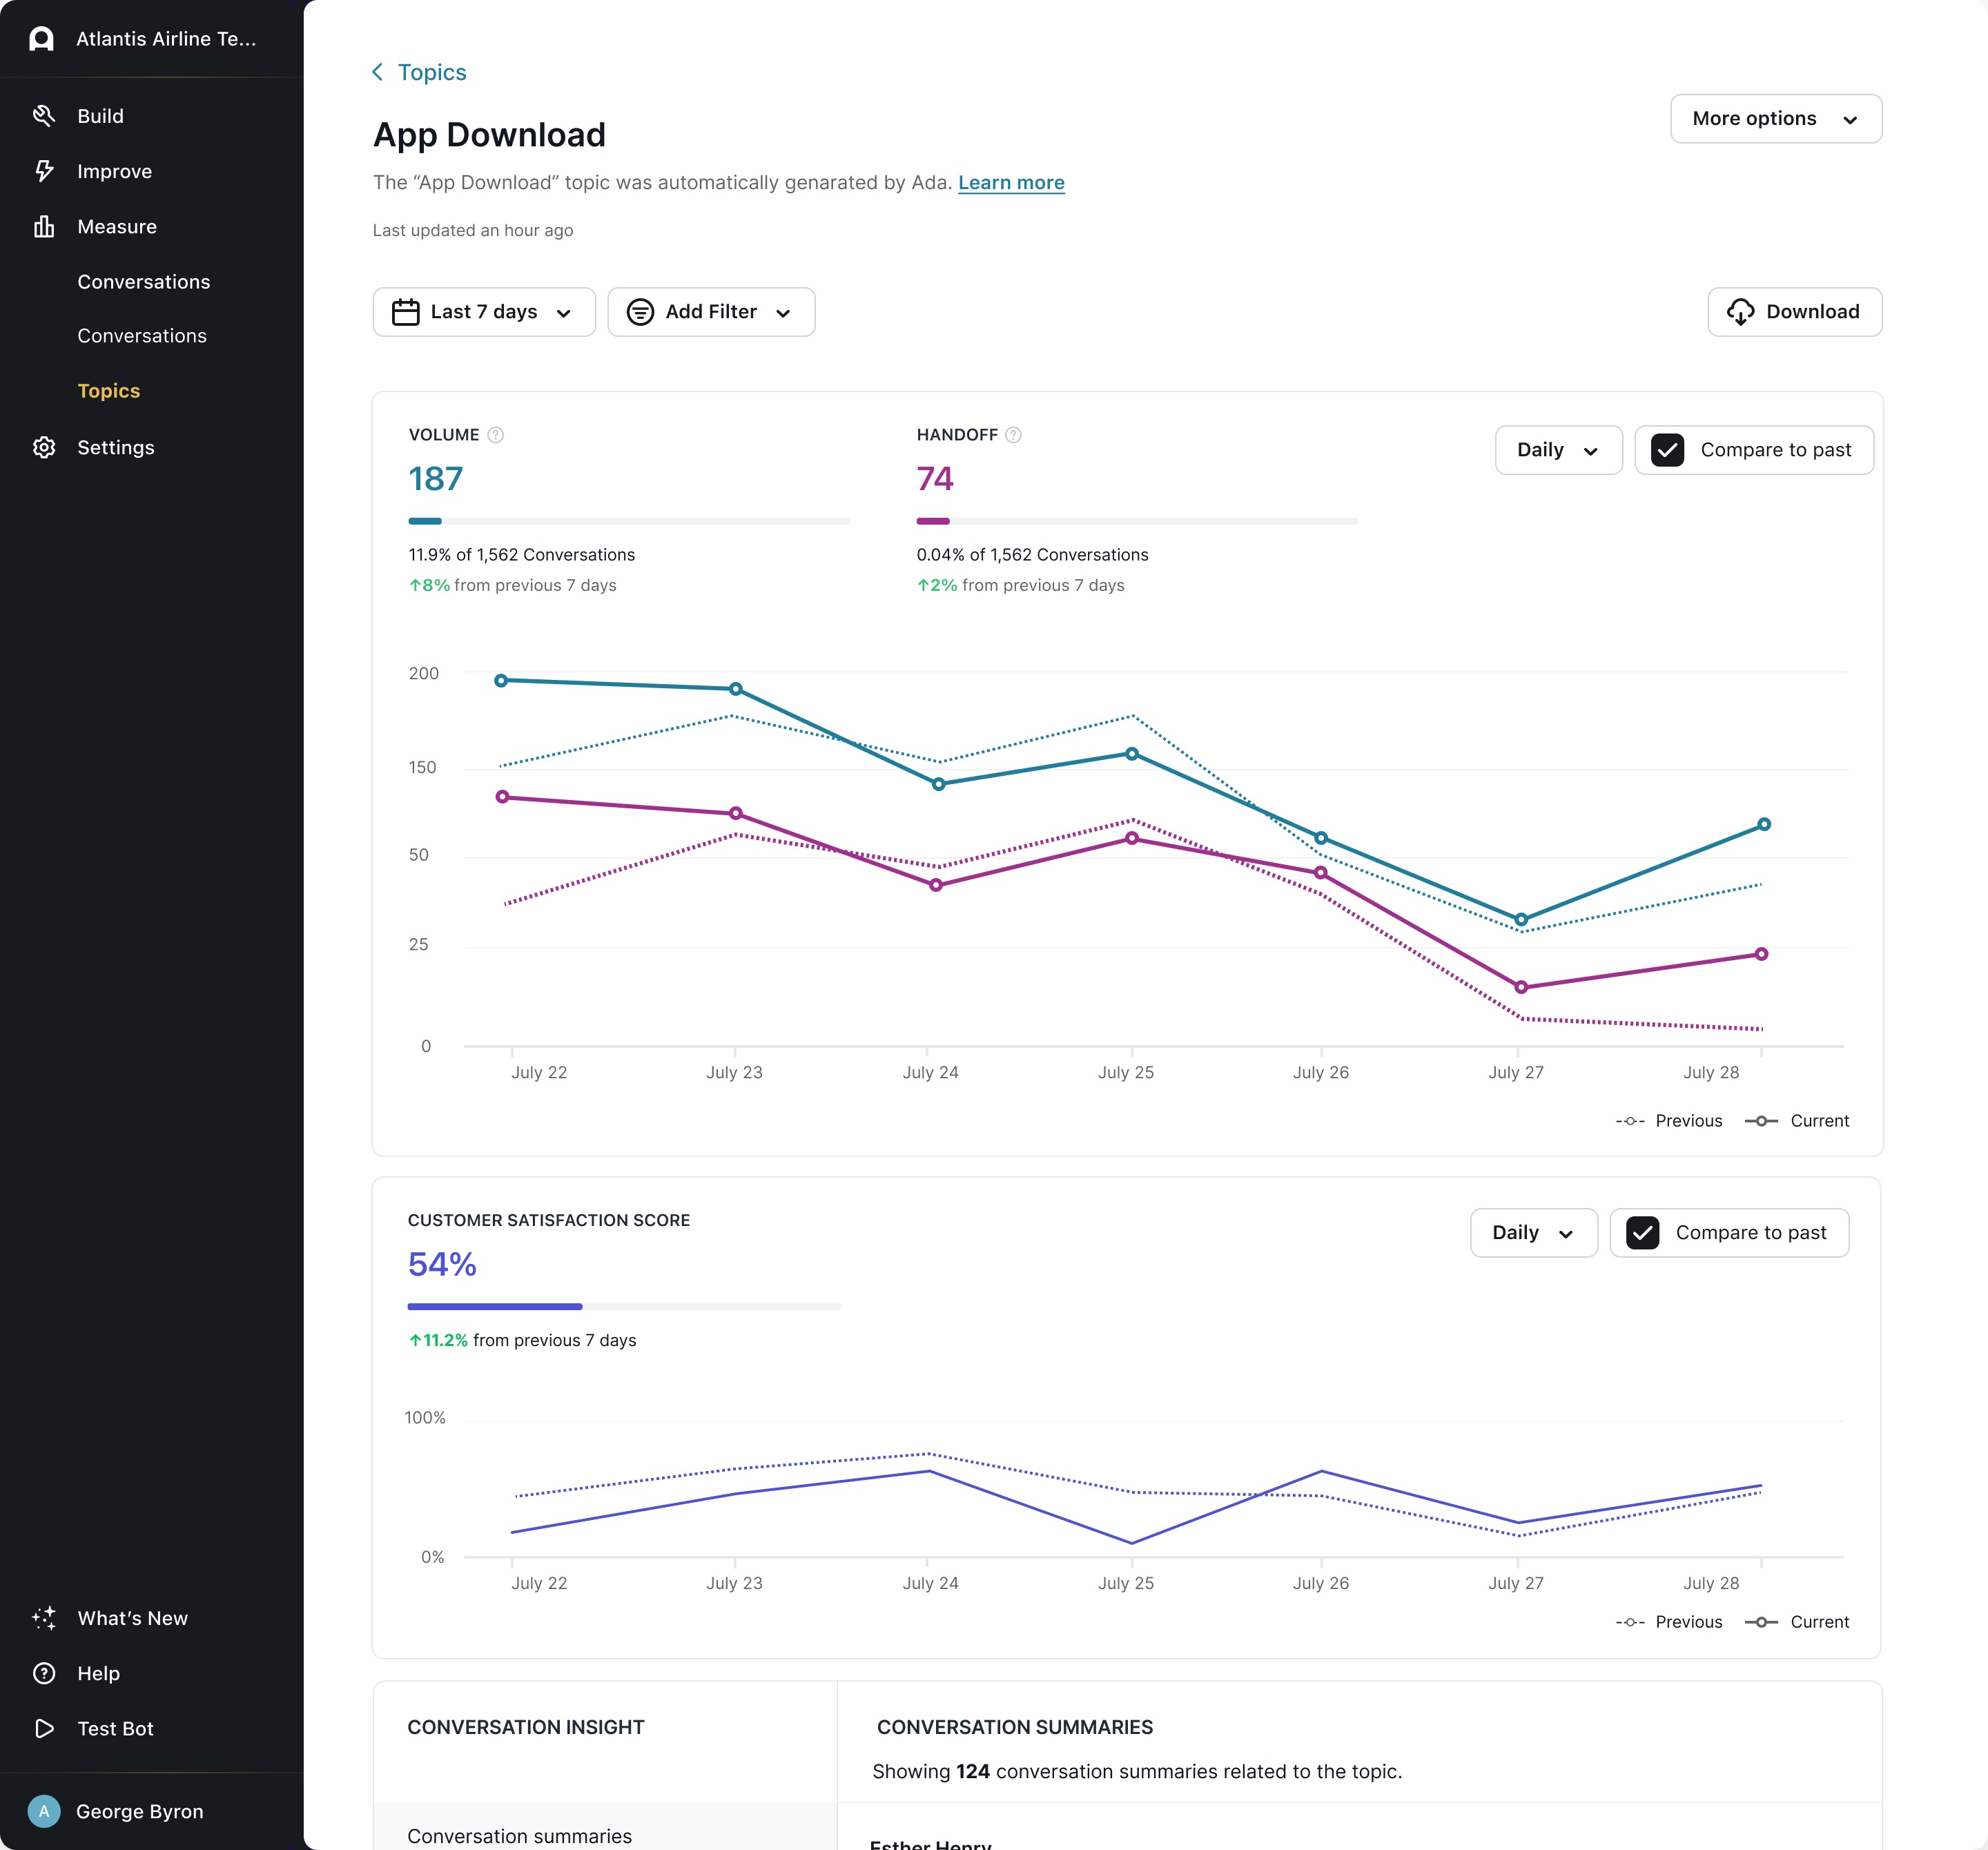
Conversation Topics Breakdown
View how a particular conversation topic performed. For more information, see Track conversation topics.
This report isn’t listed with the other reports; instead, you can see it if you go to Conversations > Topics in your Ada dashboard and click on a topic to see more detail.
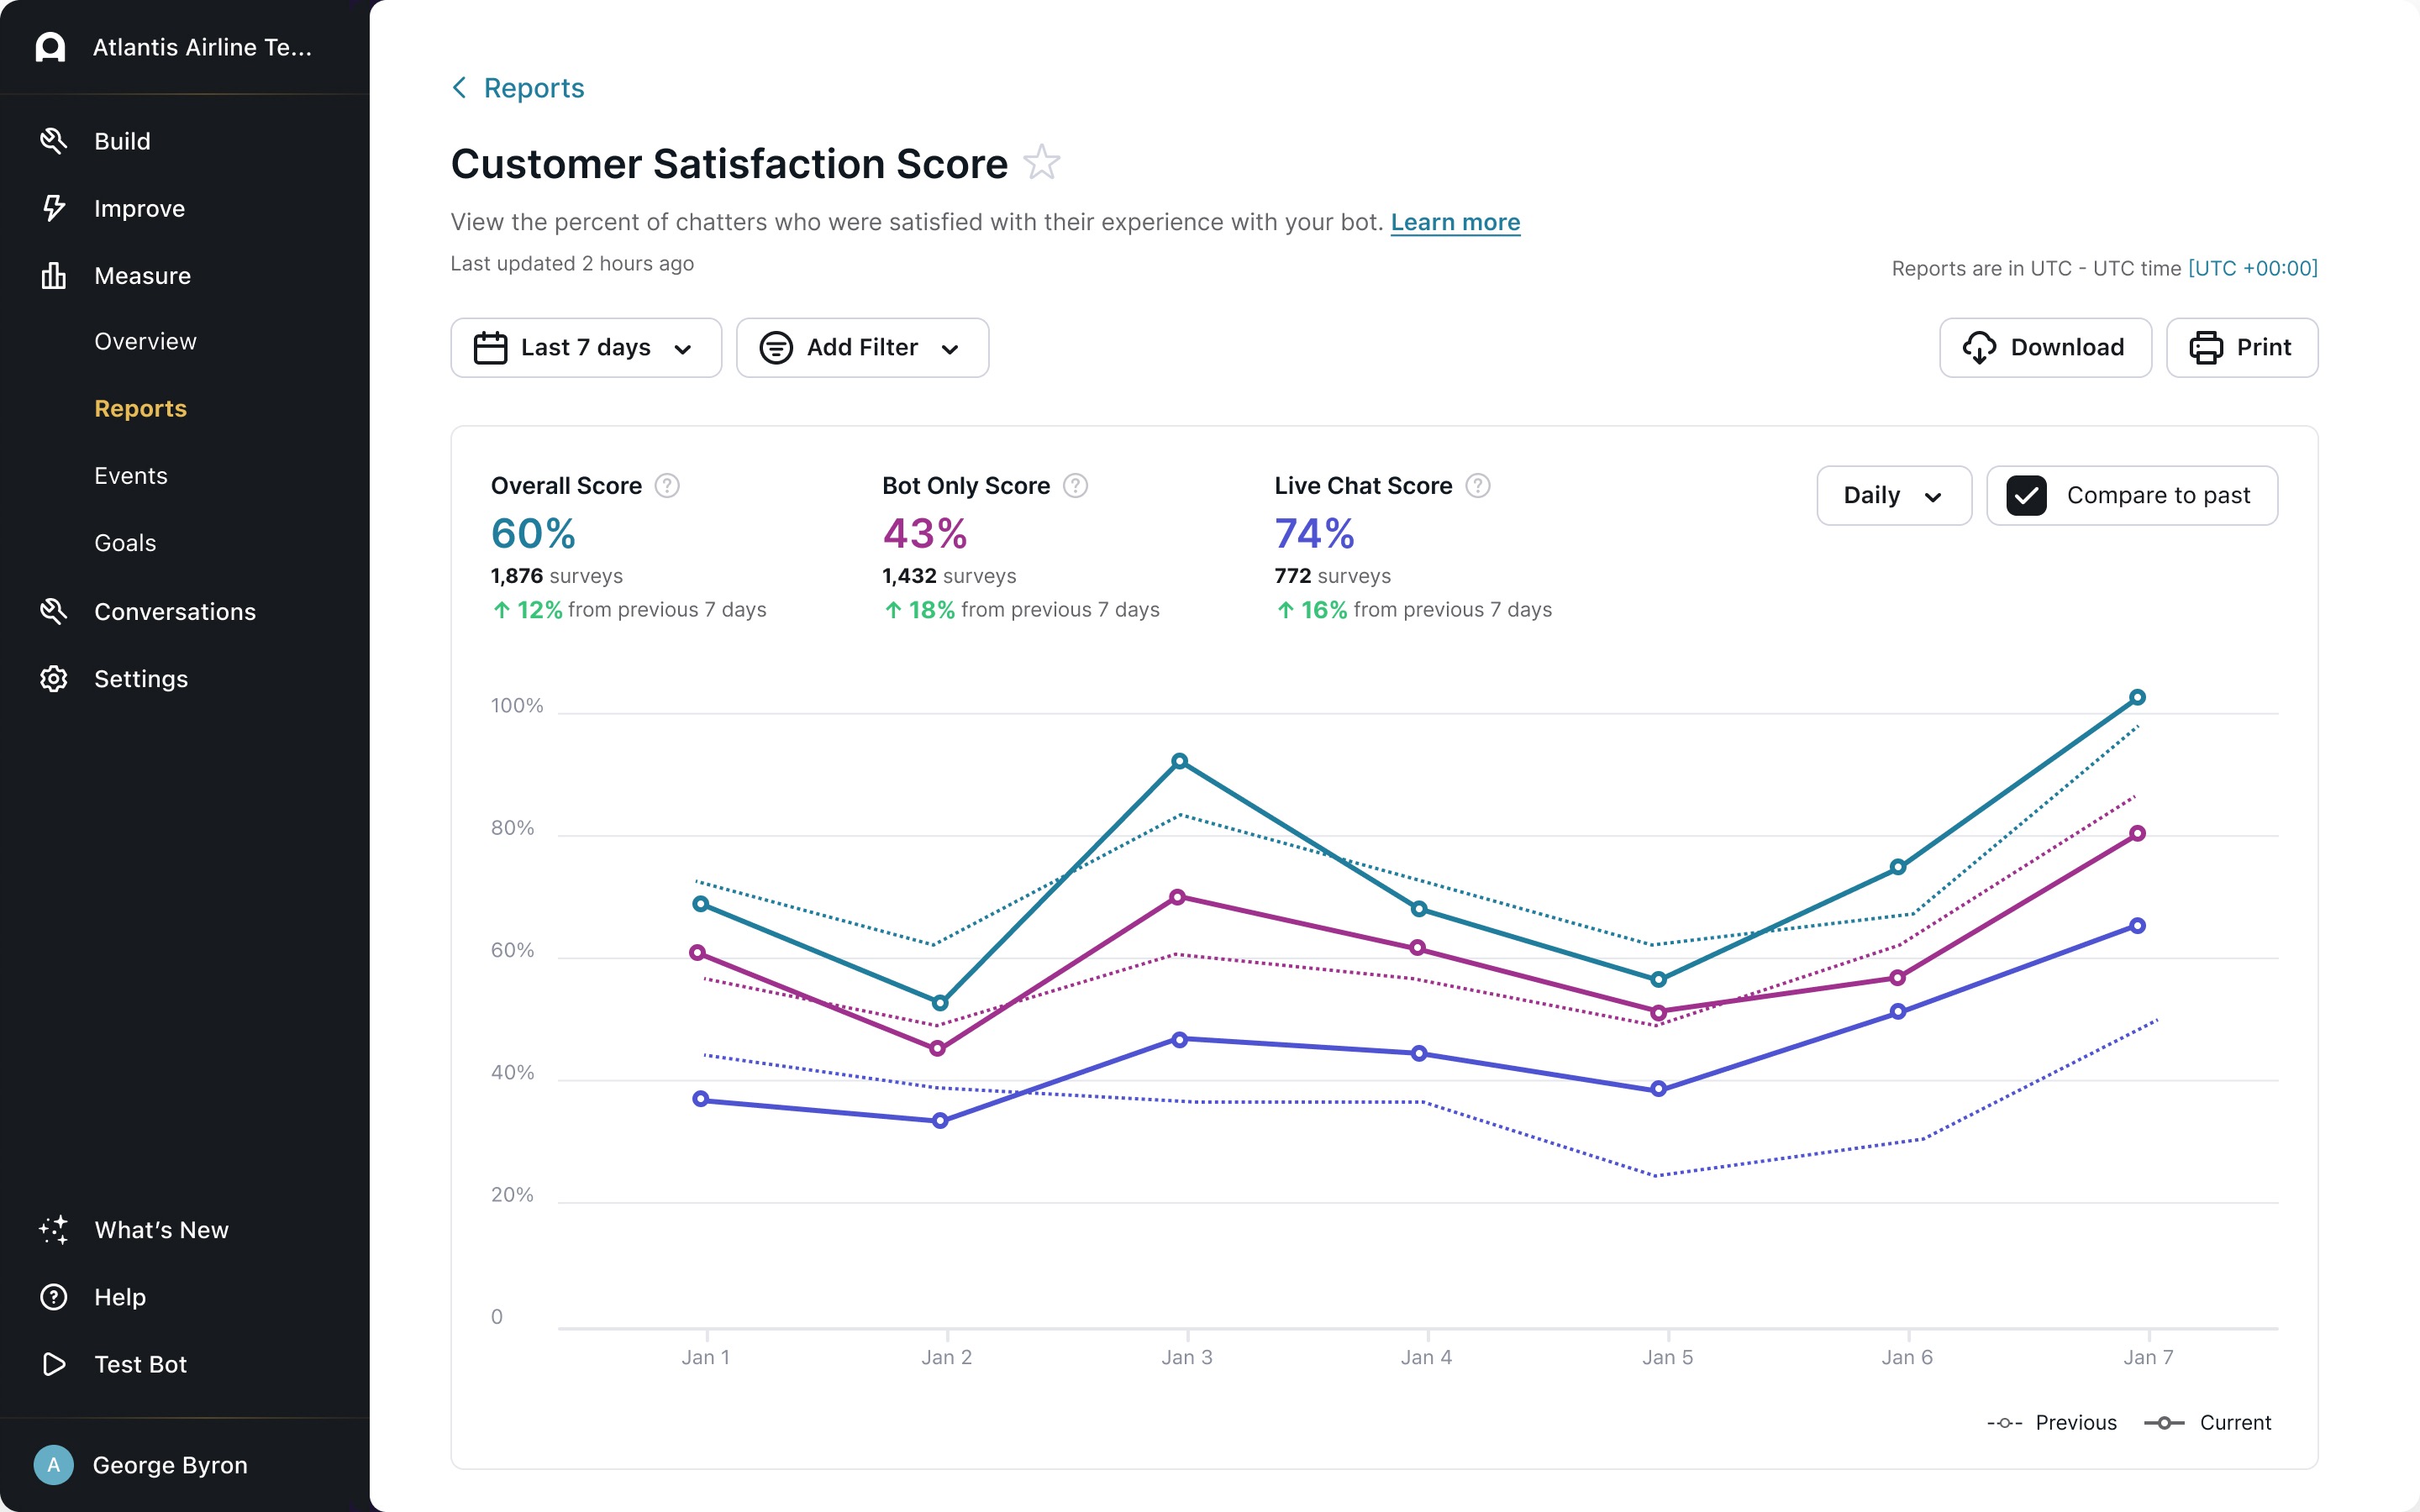
Customer Satisfaction Score
View the percent of your bot’s conversations that chatters reviewed positively. For more information, see Collect and analyze chatter satisfaction data with Satisfaction Surveys.
Chatters can rate conversations in surveys at the end of the chat, the Anytime Survey, or a survey triggered by an Answer with a Satisfaction Survey block. If the survey appeared more than once in a single conversation, the bot will show the previous selection to the chatter, allowing them to update their feedback. Only the most recent rating is recorded per conversation; the latest rating overrides any previous ratings.
There are three ways you can set up customer satisfaction reviews:
There are four ways you can set up customer satisfaction reviews, each with different scales for recording feedback:
Engagement Rate
View how often customers chose to chat with your bot.

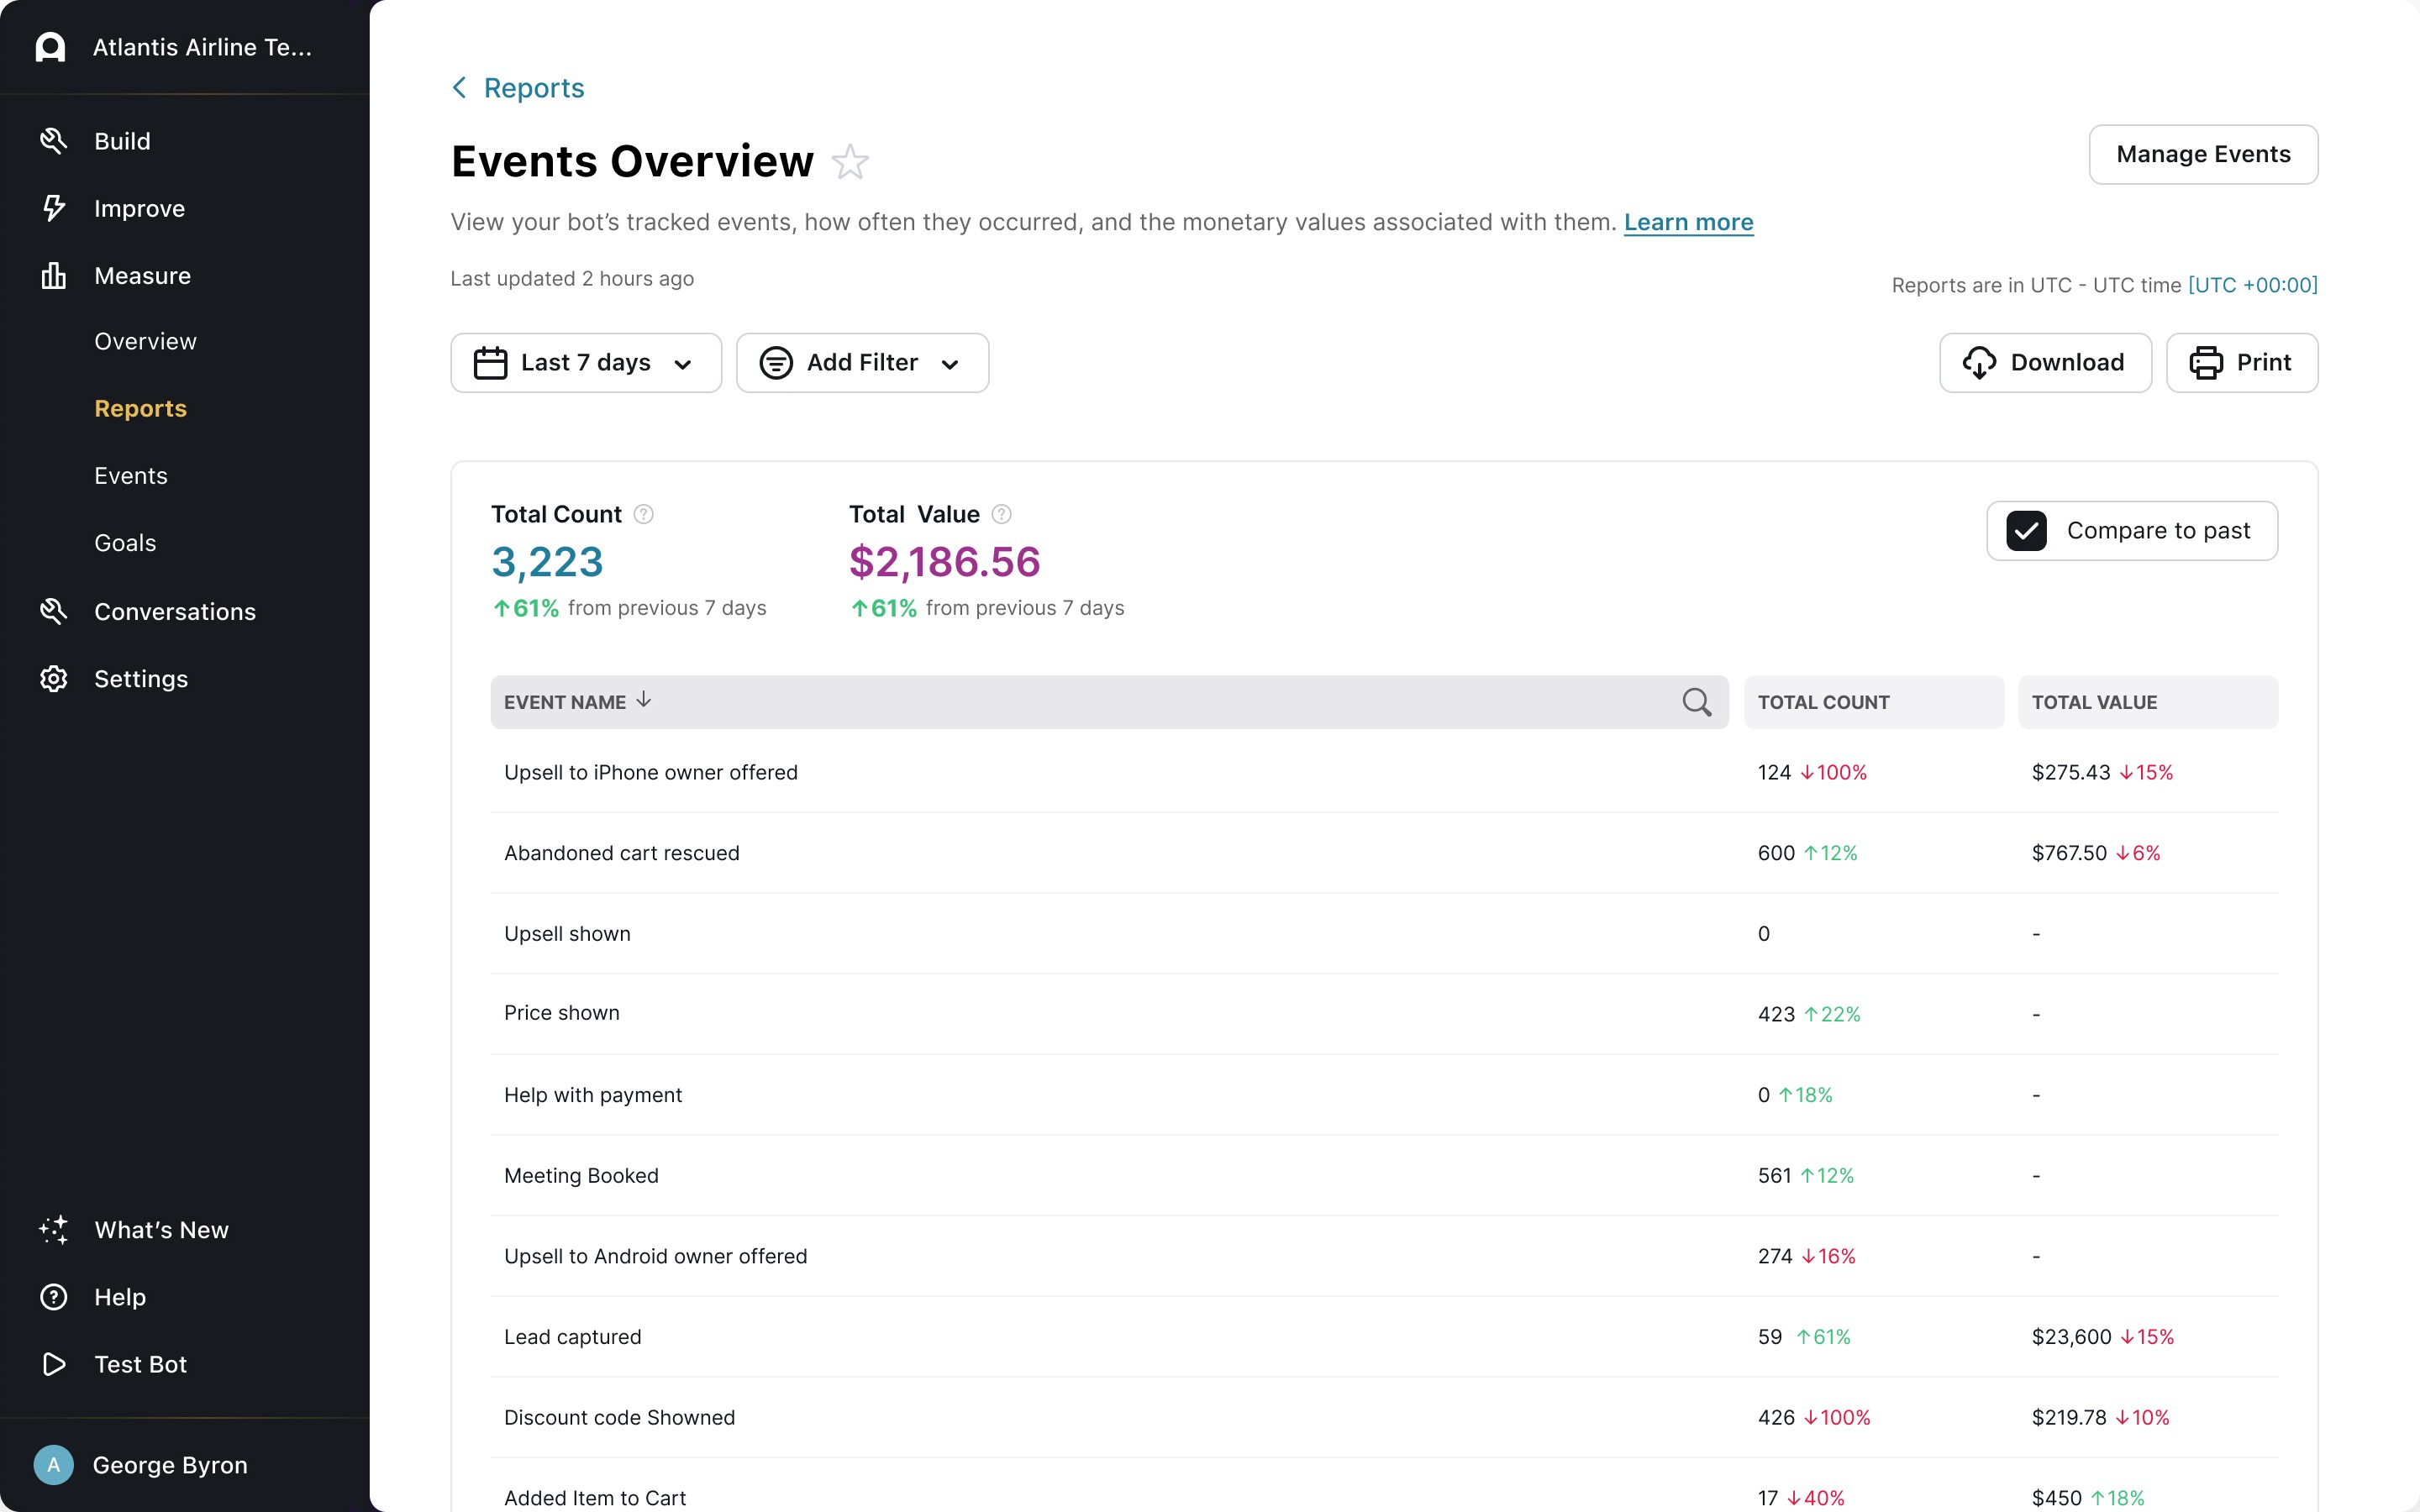
Events Overview
View your bot’s tracked events, how often they occurred, and the monetary values associated with them. For more information, see Create and track chatter actions.
Events Breakdown

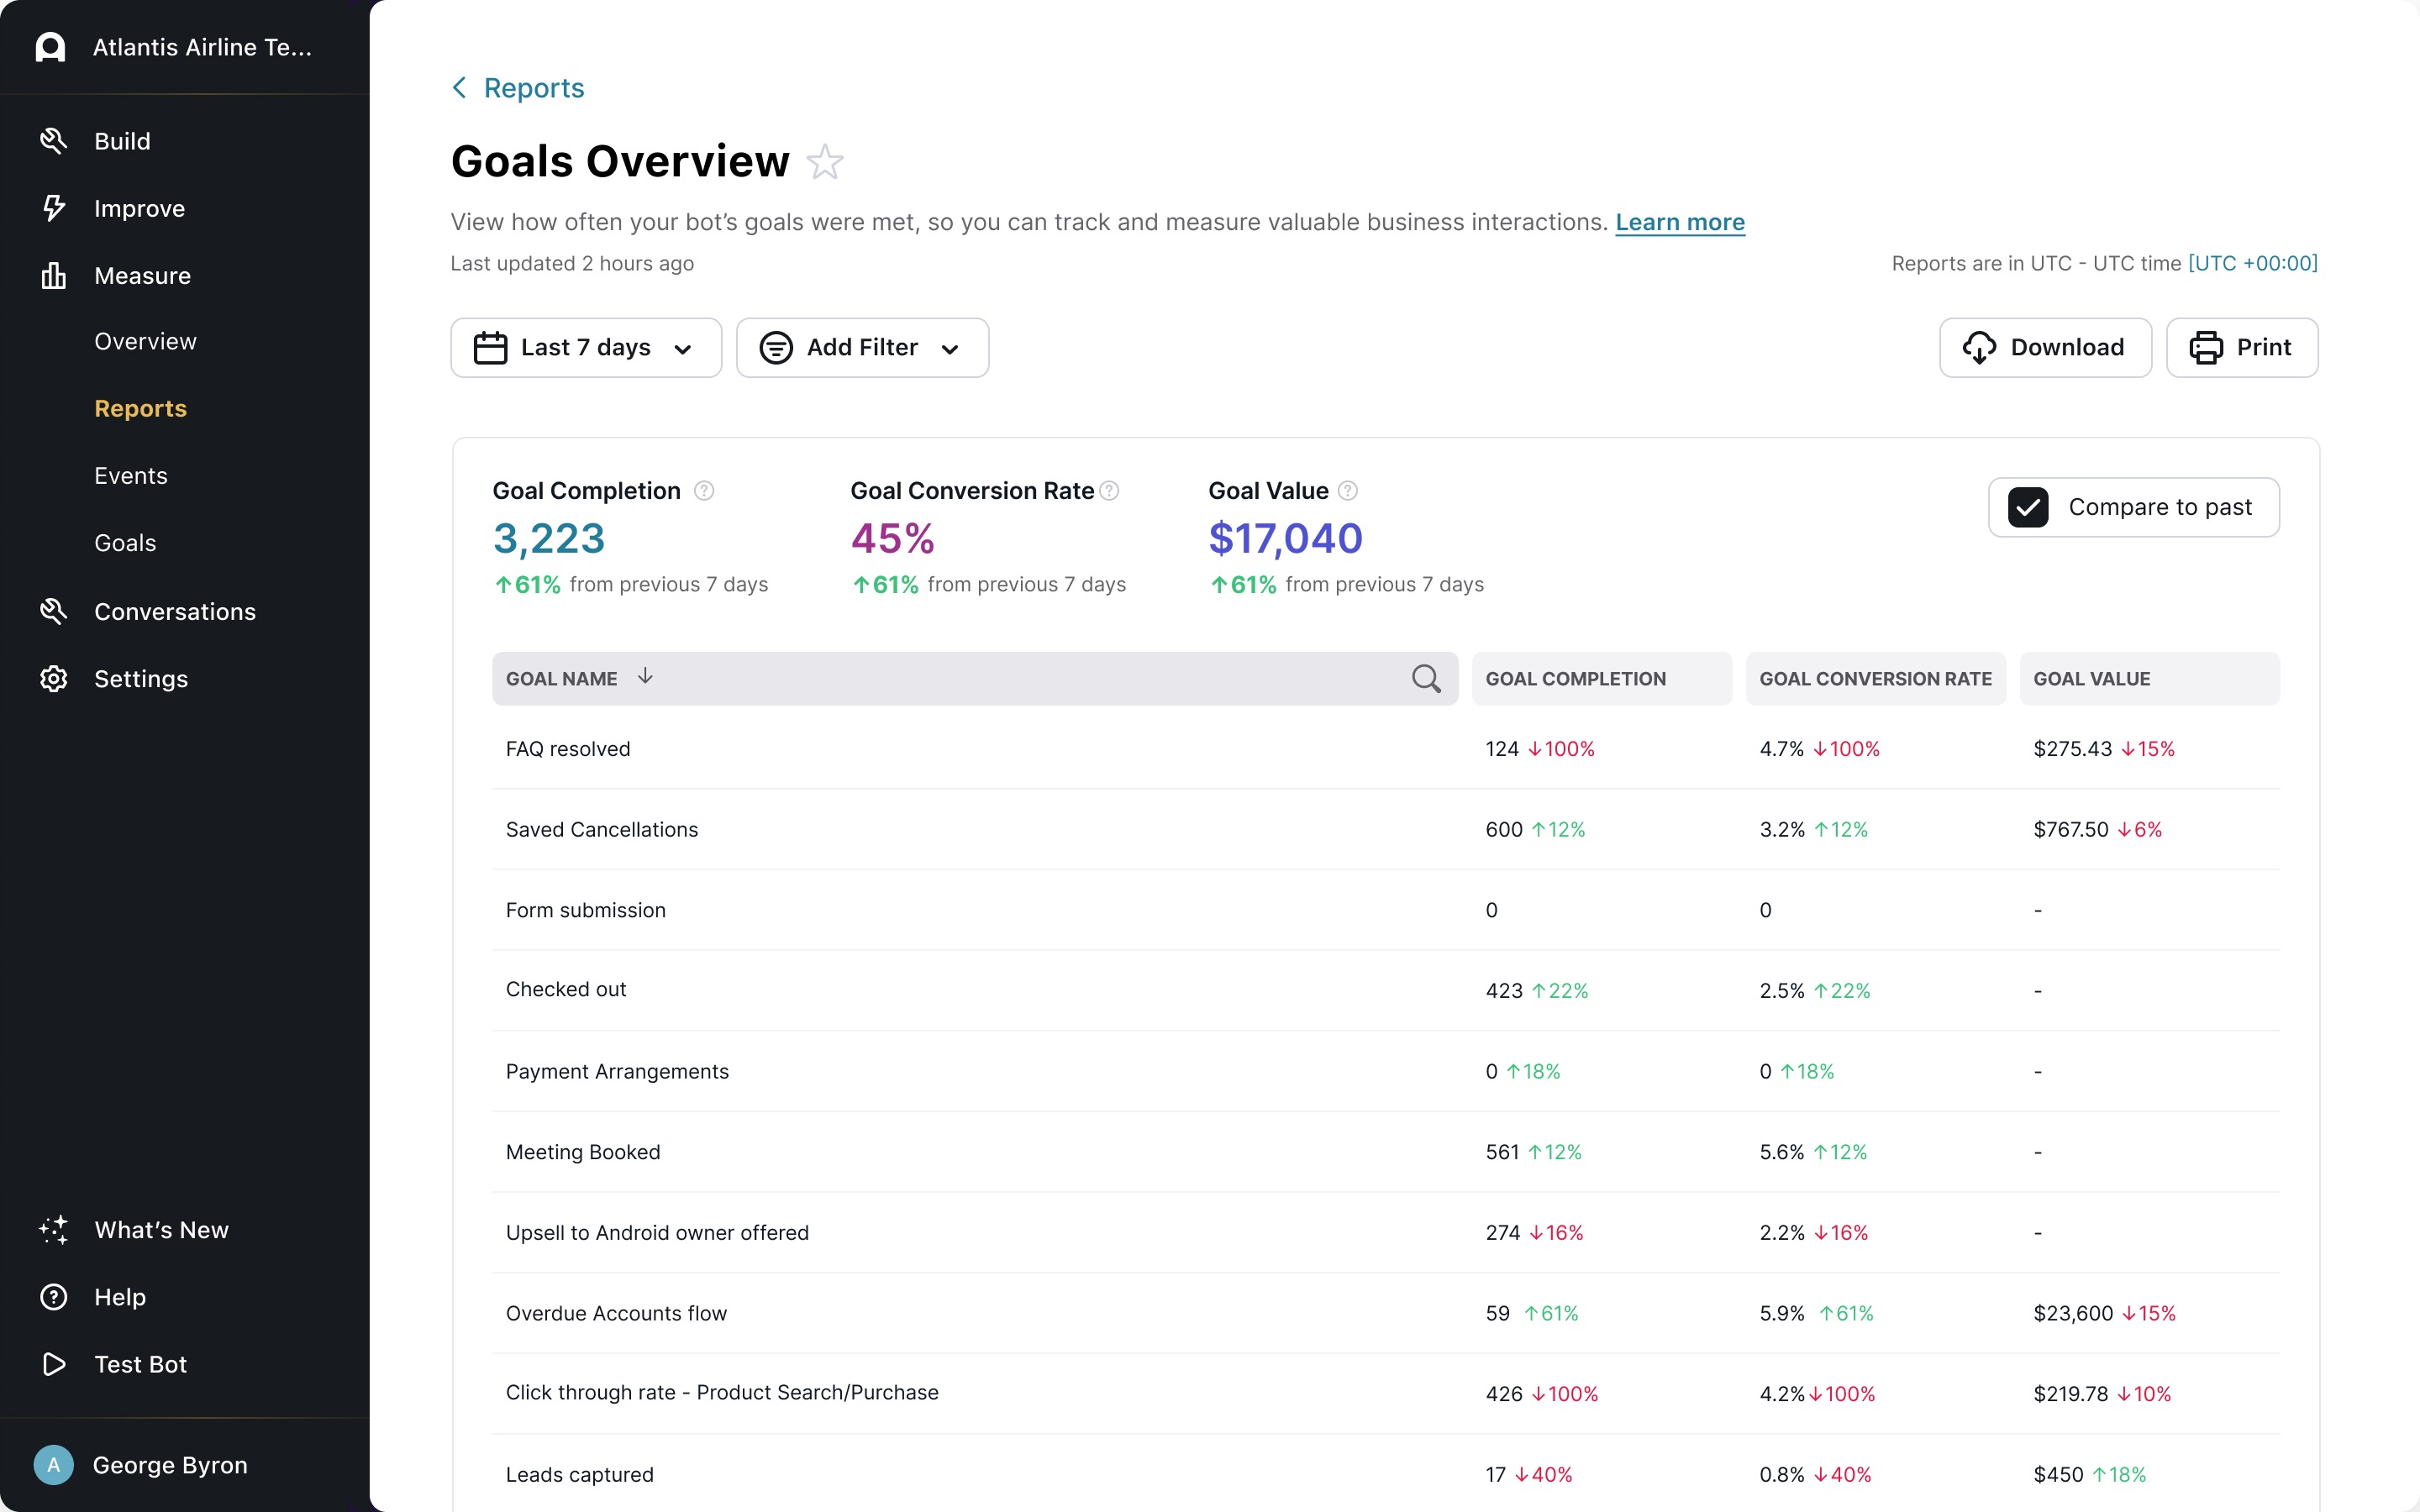
Goals Overview
View how often your bot’s goals were met, so you can track and measure valuable business interactions. For more information, see Set goals to measure your bot’s impact.
Goals Breakdown
View how a specific goal performed. For more information, see Set goals to measure your bot’s impact.
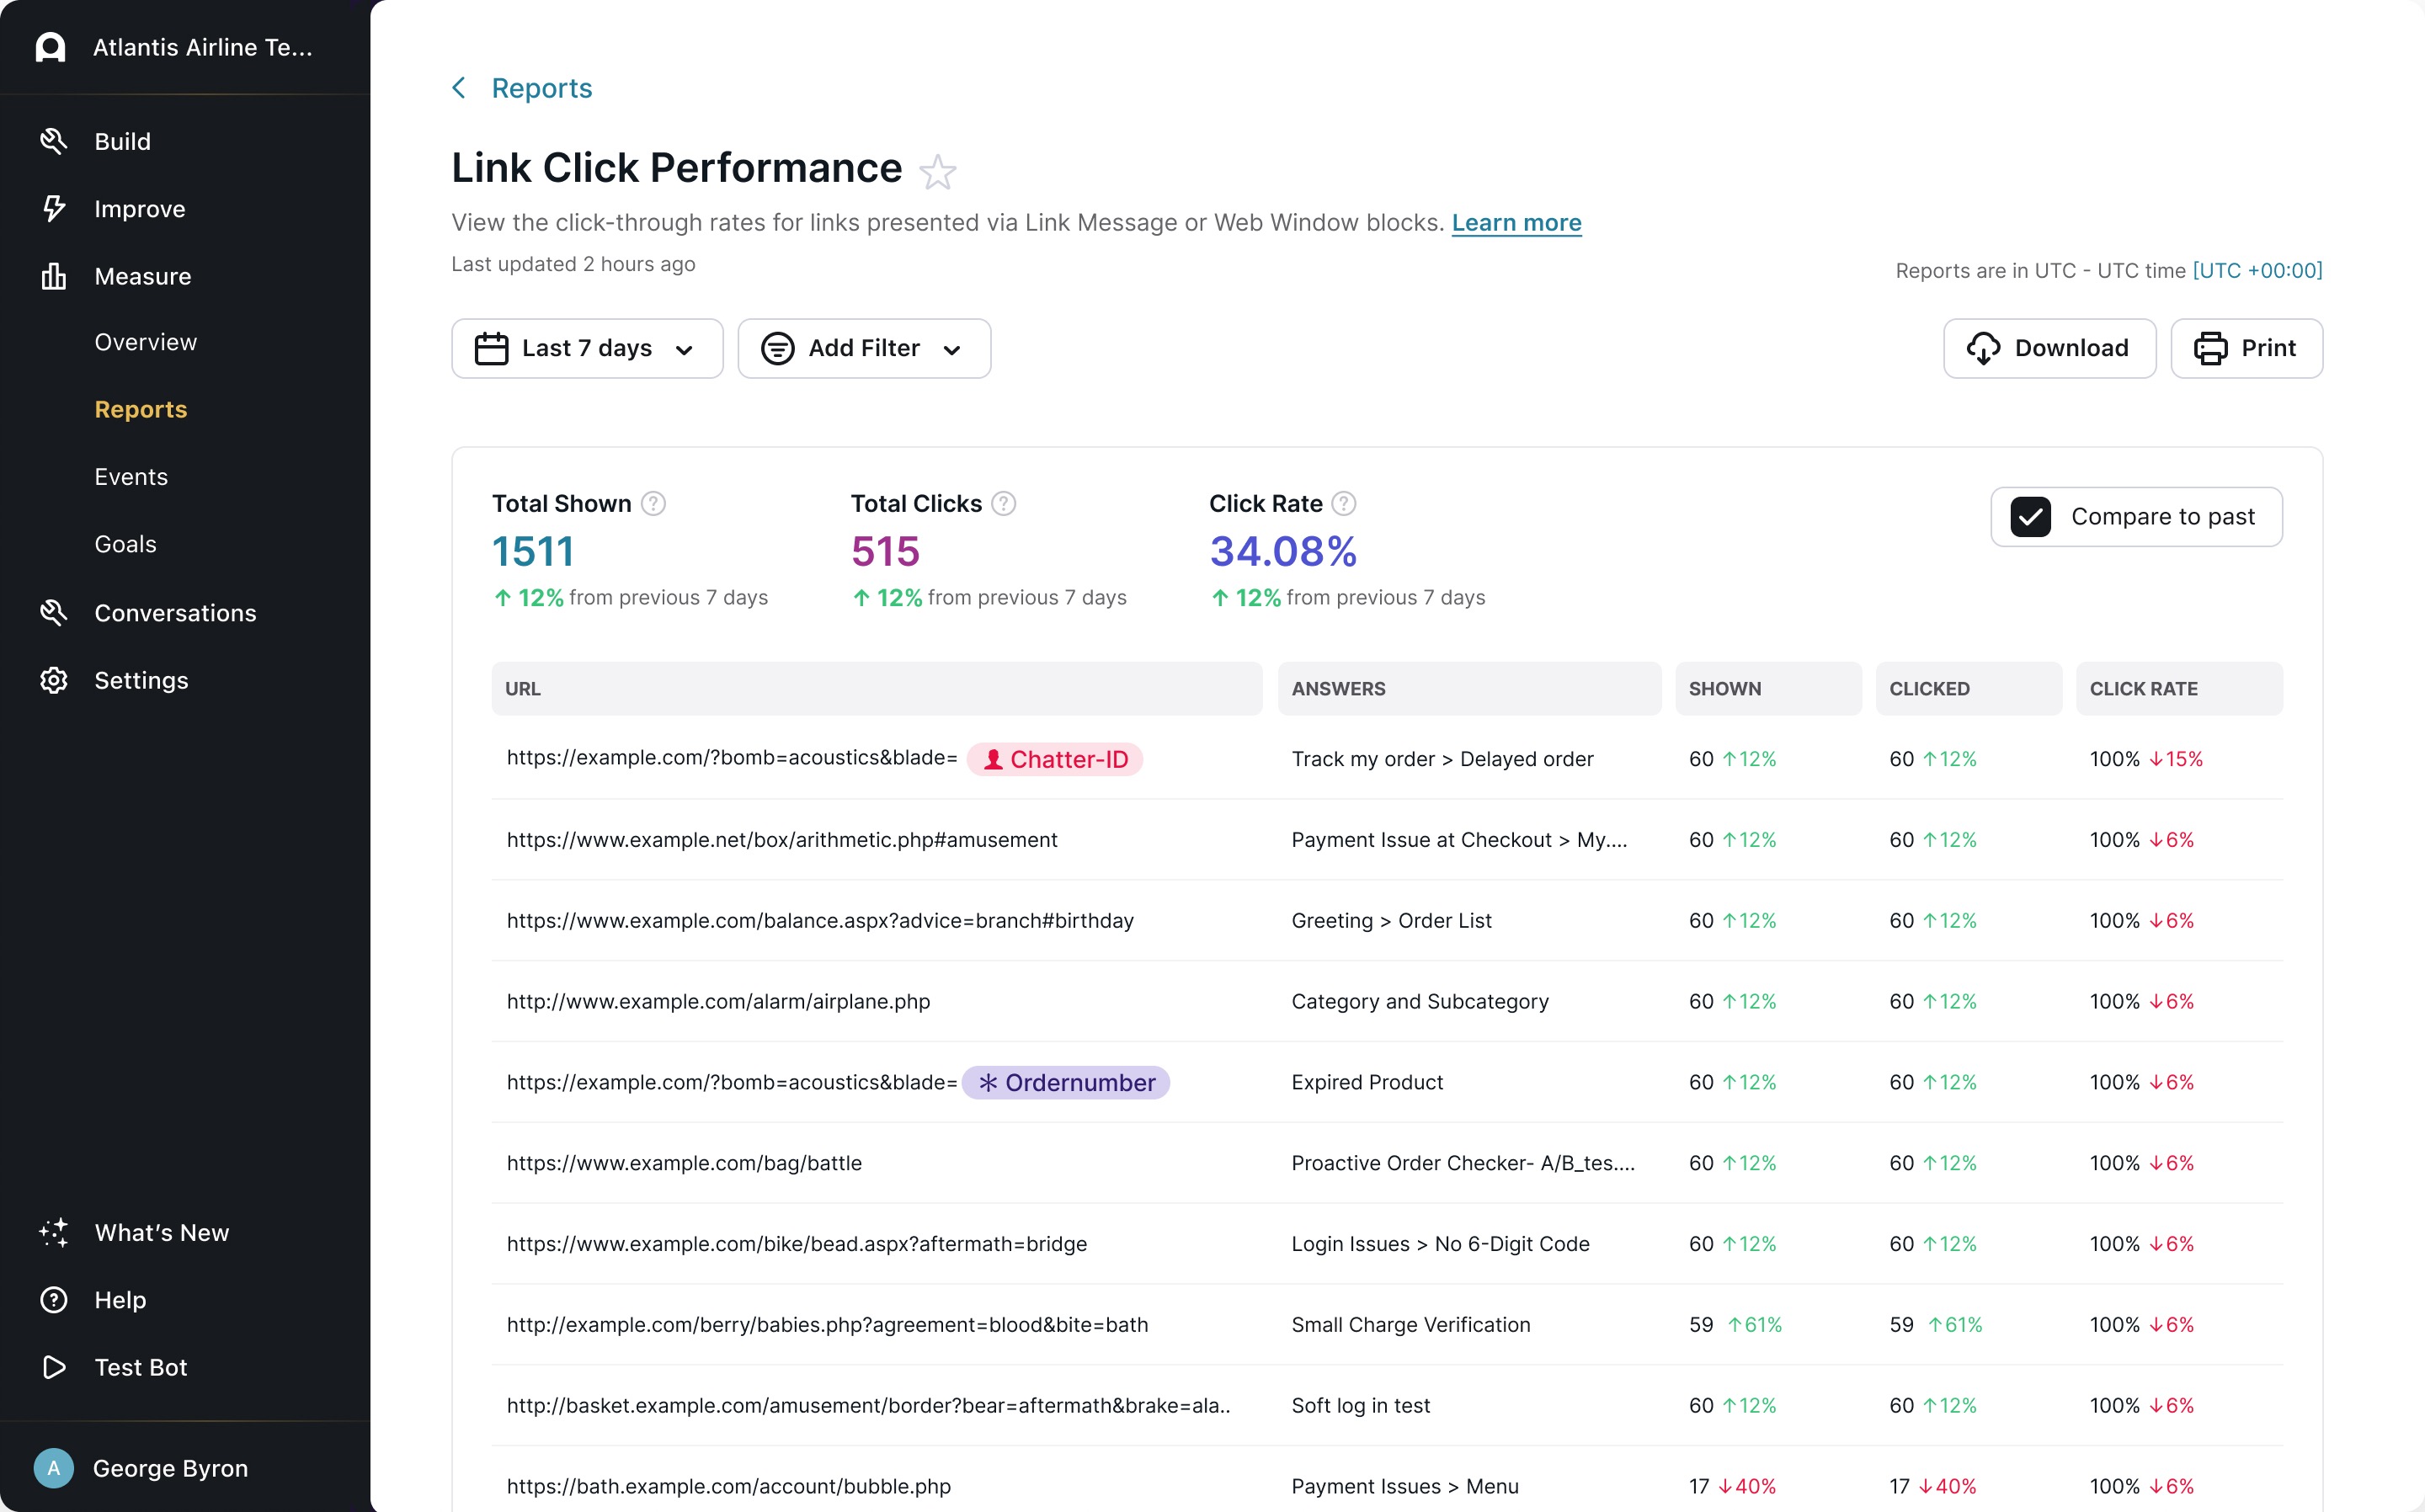
Link Click Performance
View the click-through rates for links presented via Link Message or Web Window blocks.
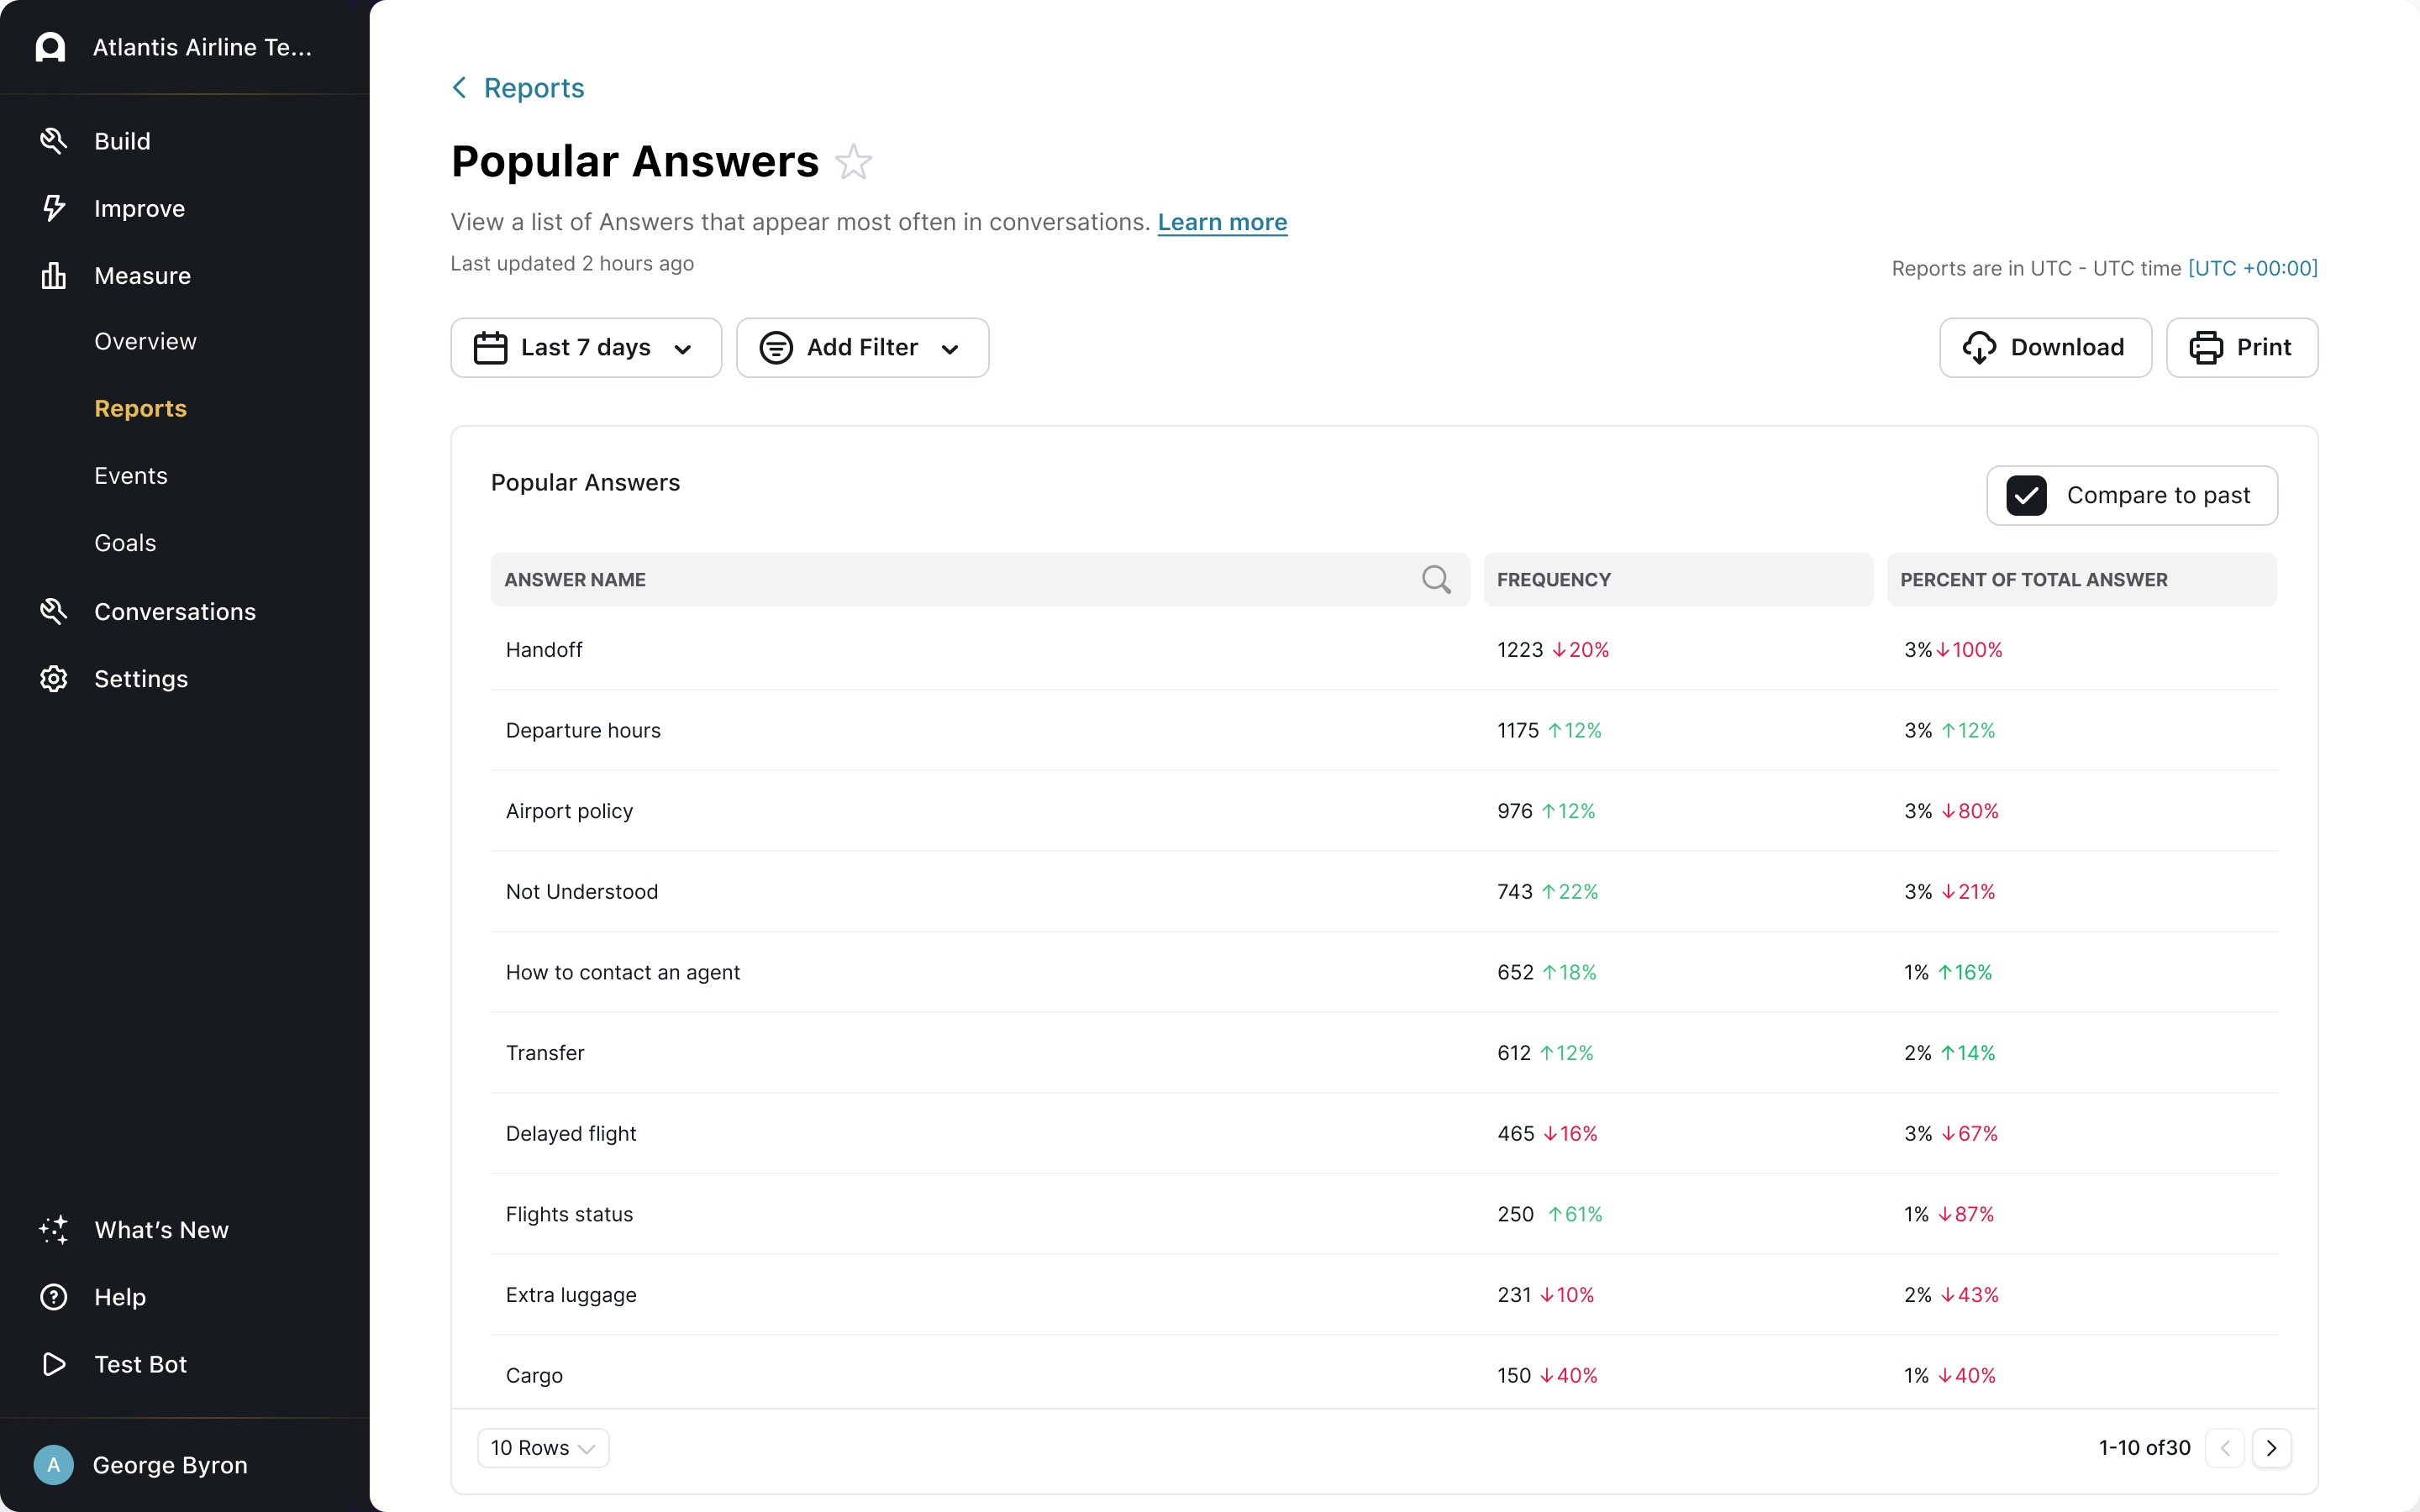
Popular Answers
View a list of Answers that appear most often in conversations.
Recognition Rate
View how often your bot was able to recognize and answer chatters’ questions. For more information, see Understand the Needs Clarification and Not Understood Answers.

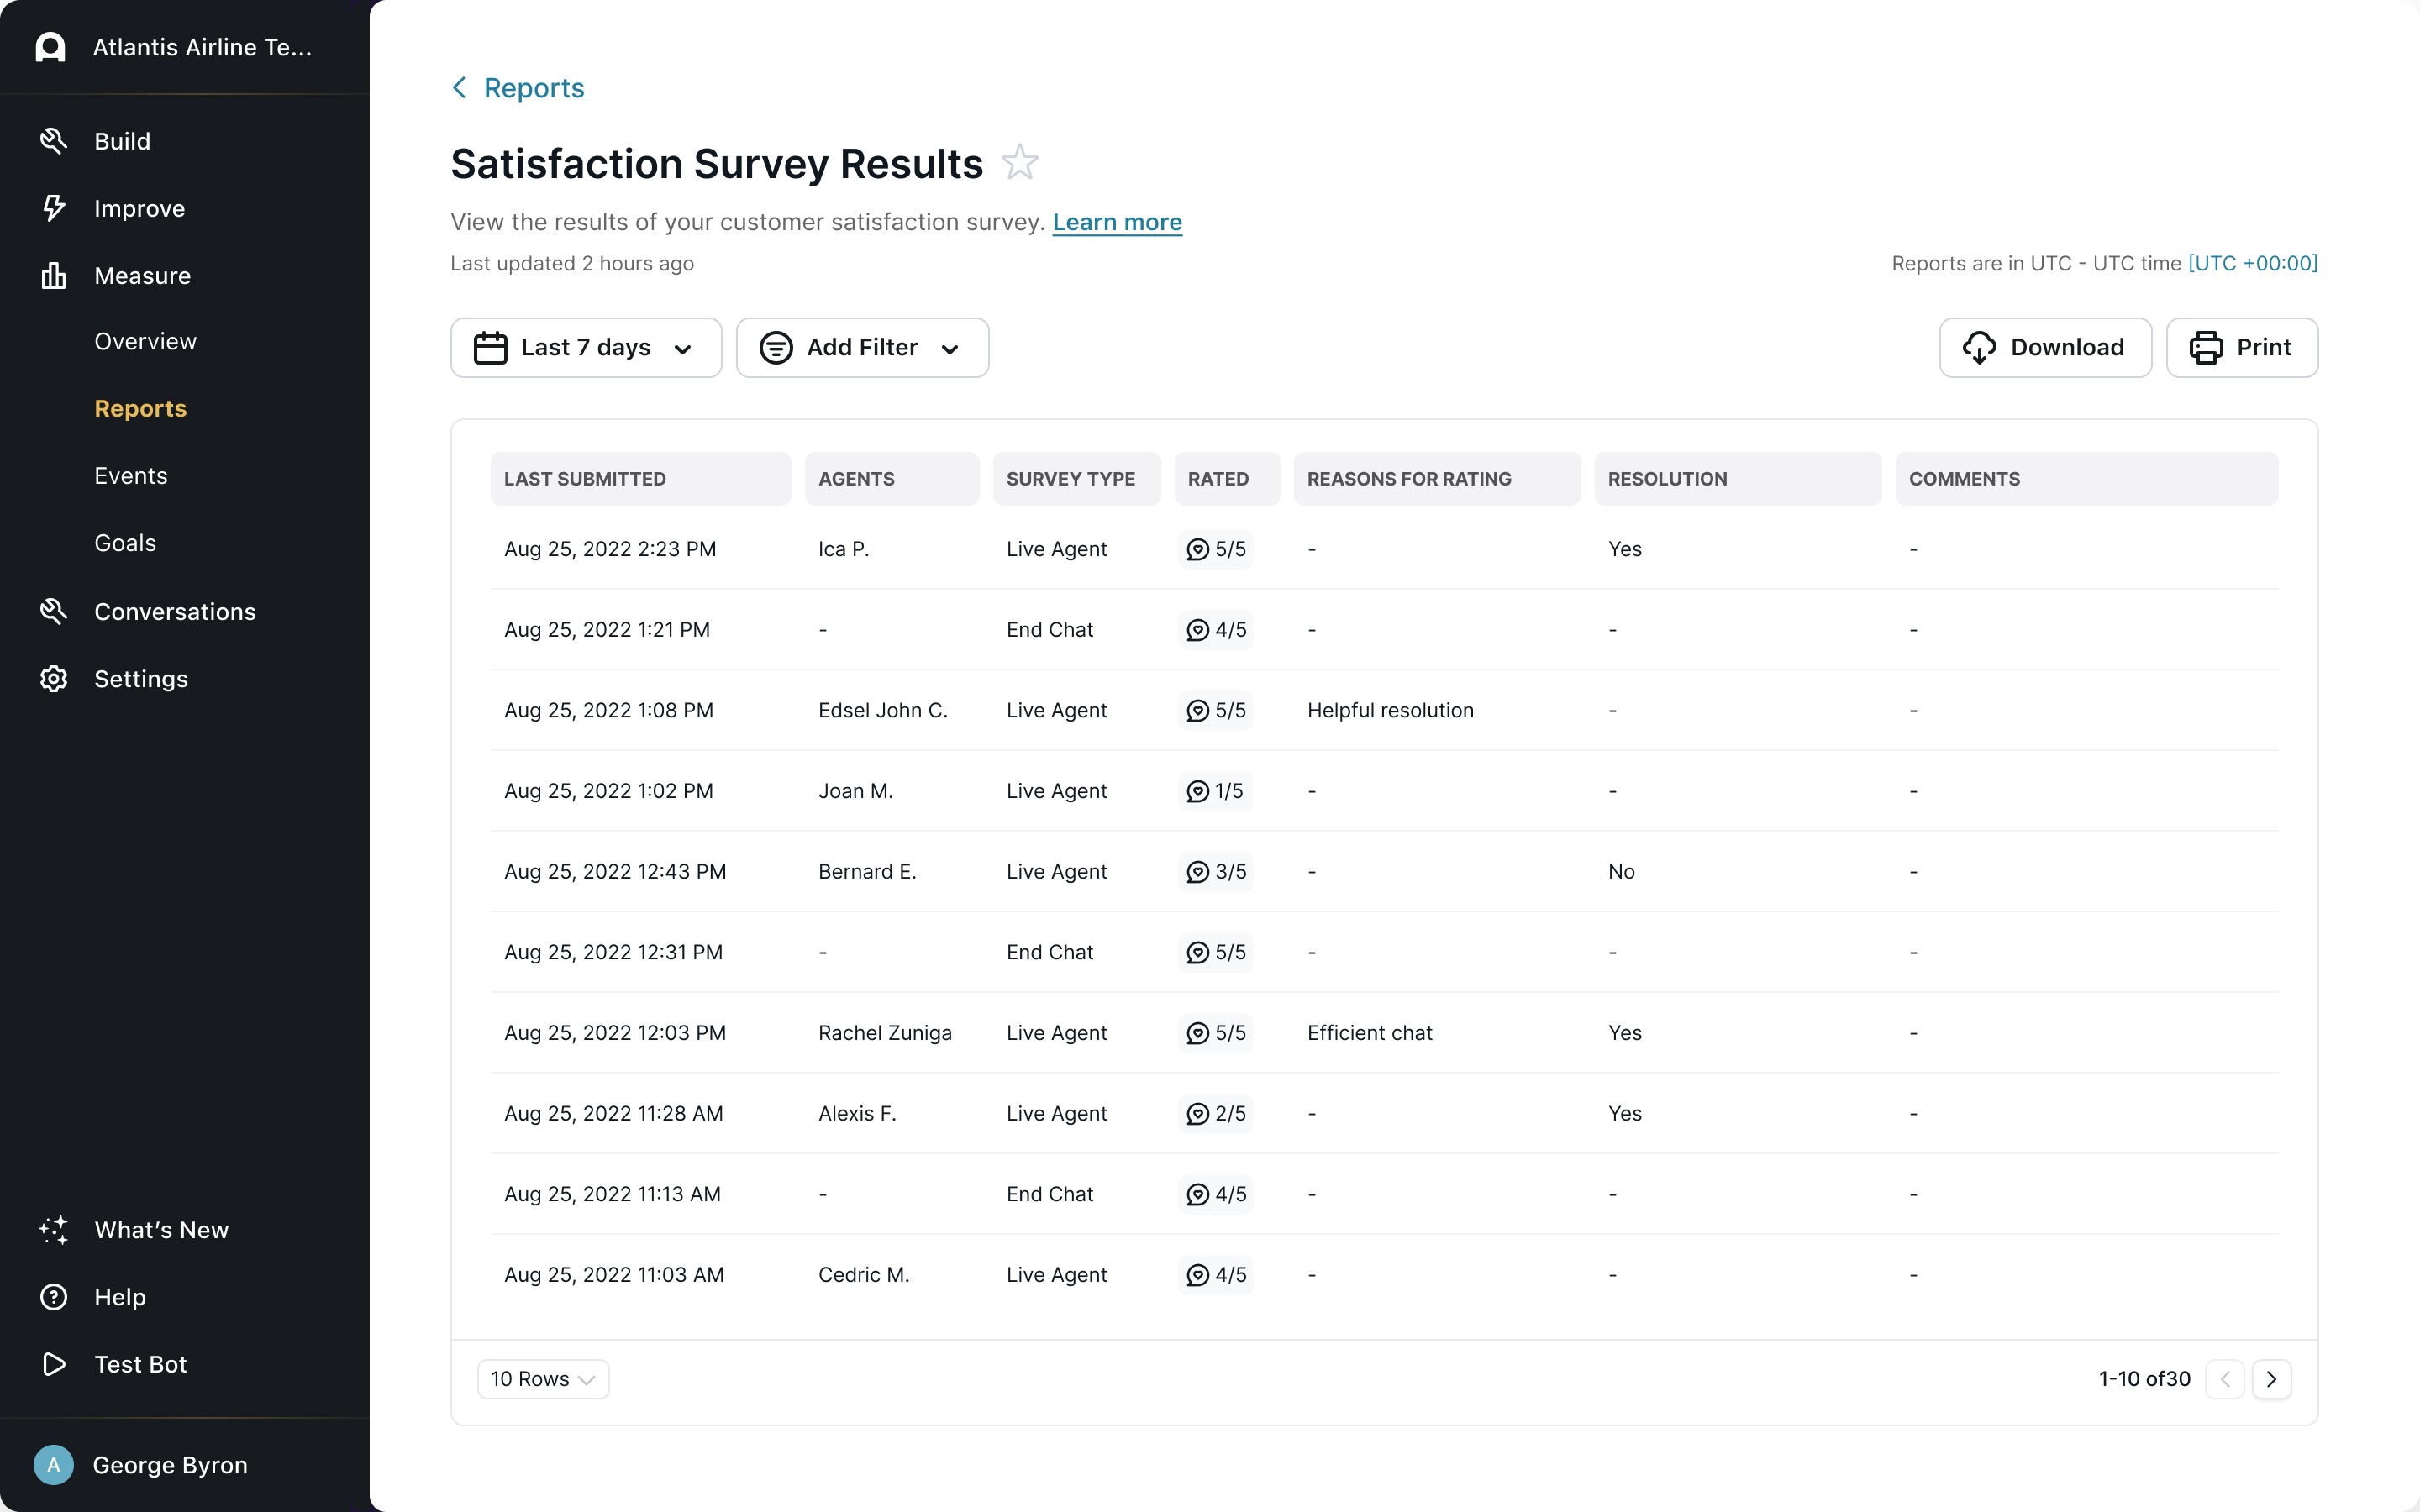
Satisfaction Survey Results
View the results of your customer satisfaction (CSAT) survey. For more information, see Collect and analyze chatter satisfaction data with Satisfaction Surveys.
When you filter this report by date, it uses the date that the user submitted their satisfaction survey, rather than the date the conversation started. As a result, the number of conversations that appear in this report may vary from other reports.
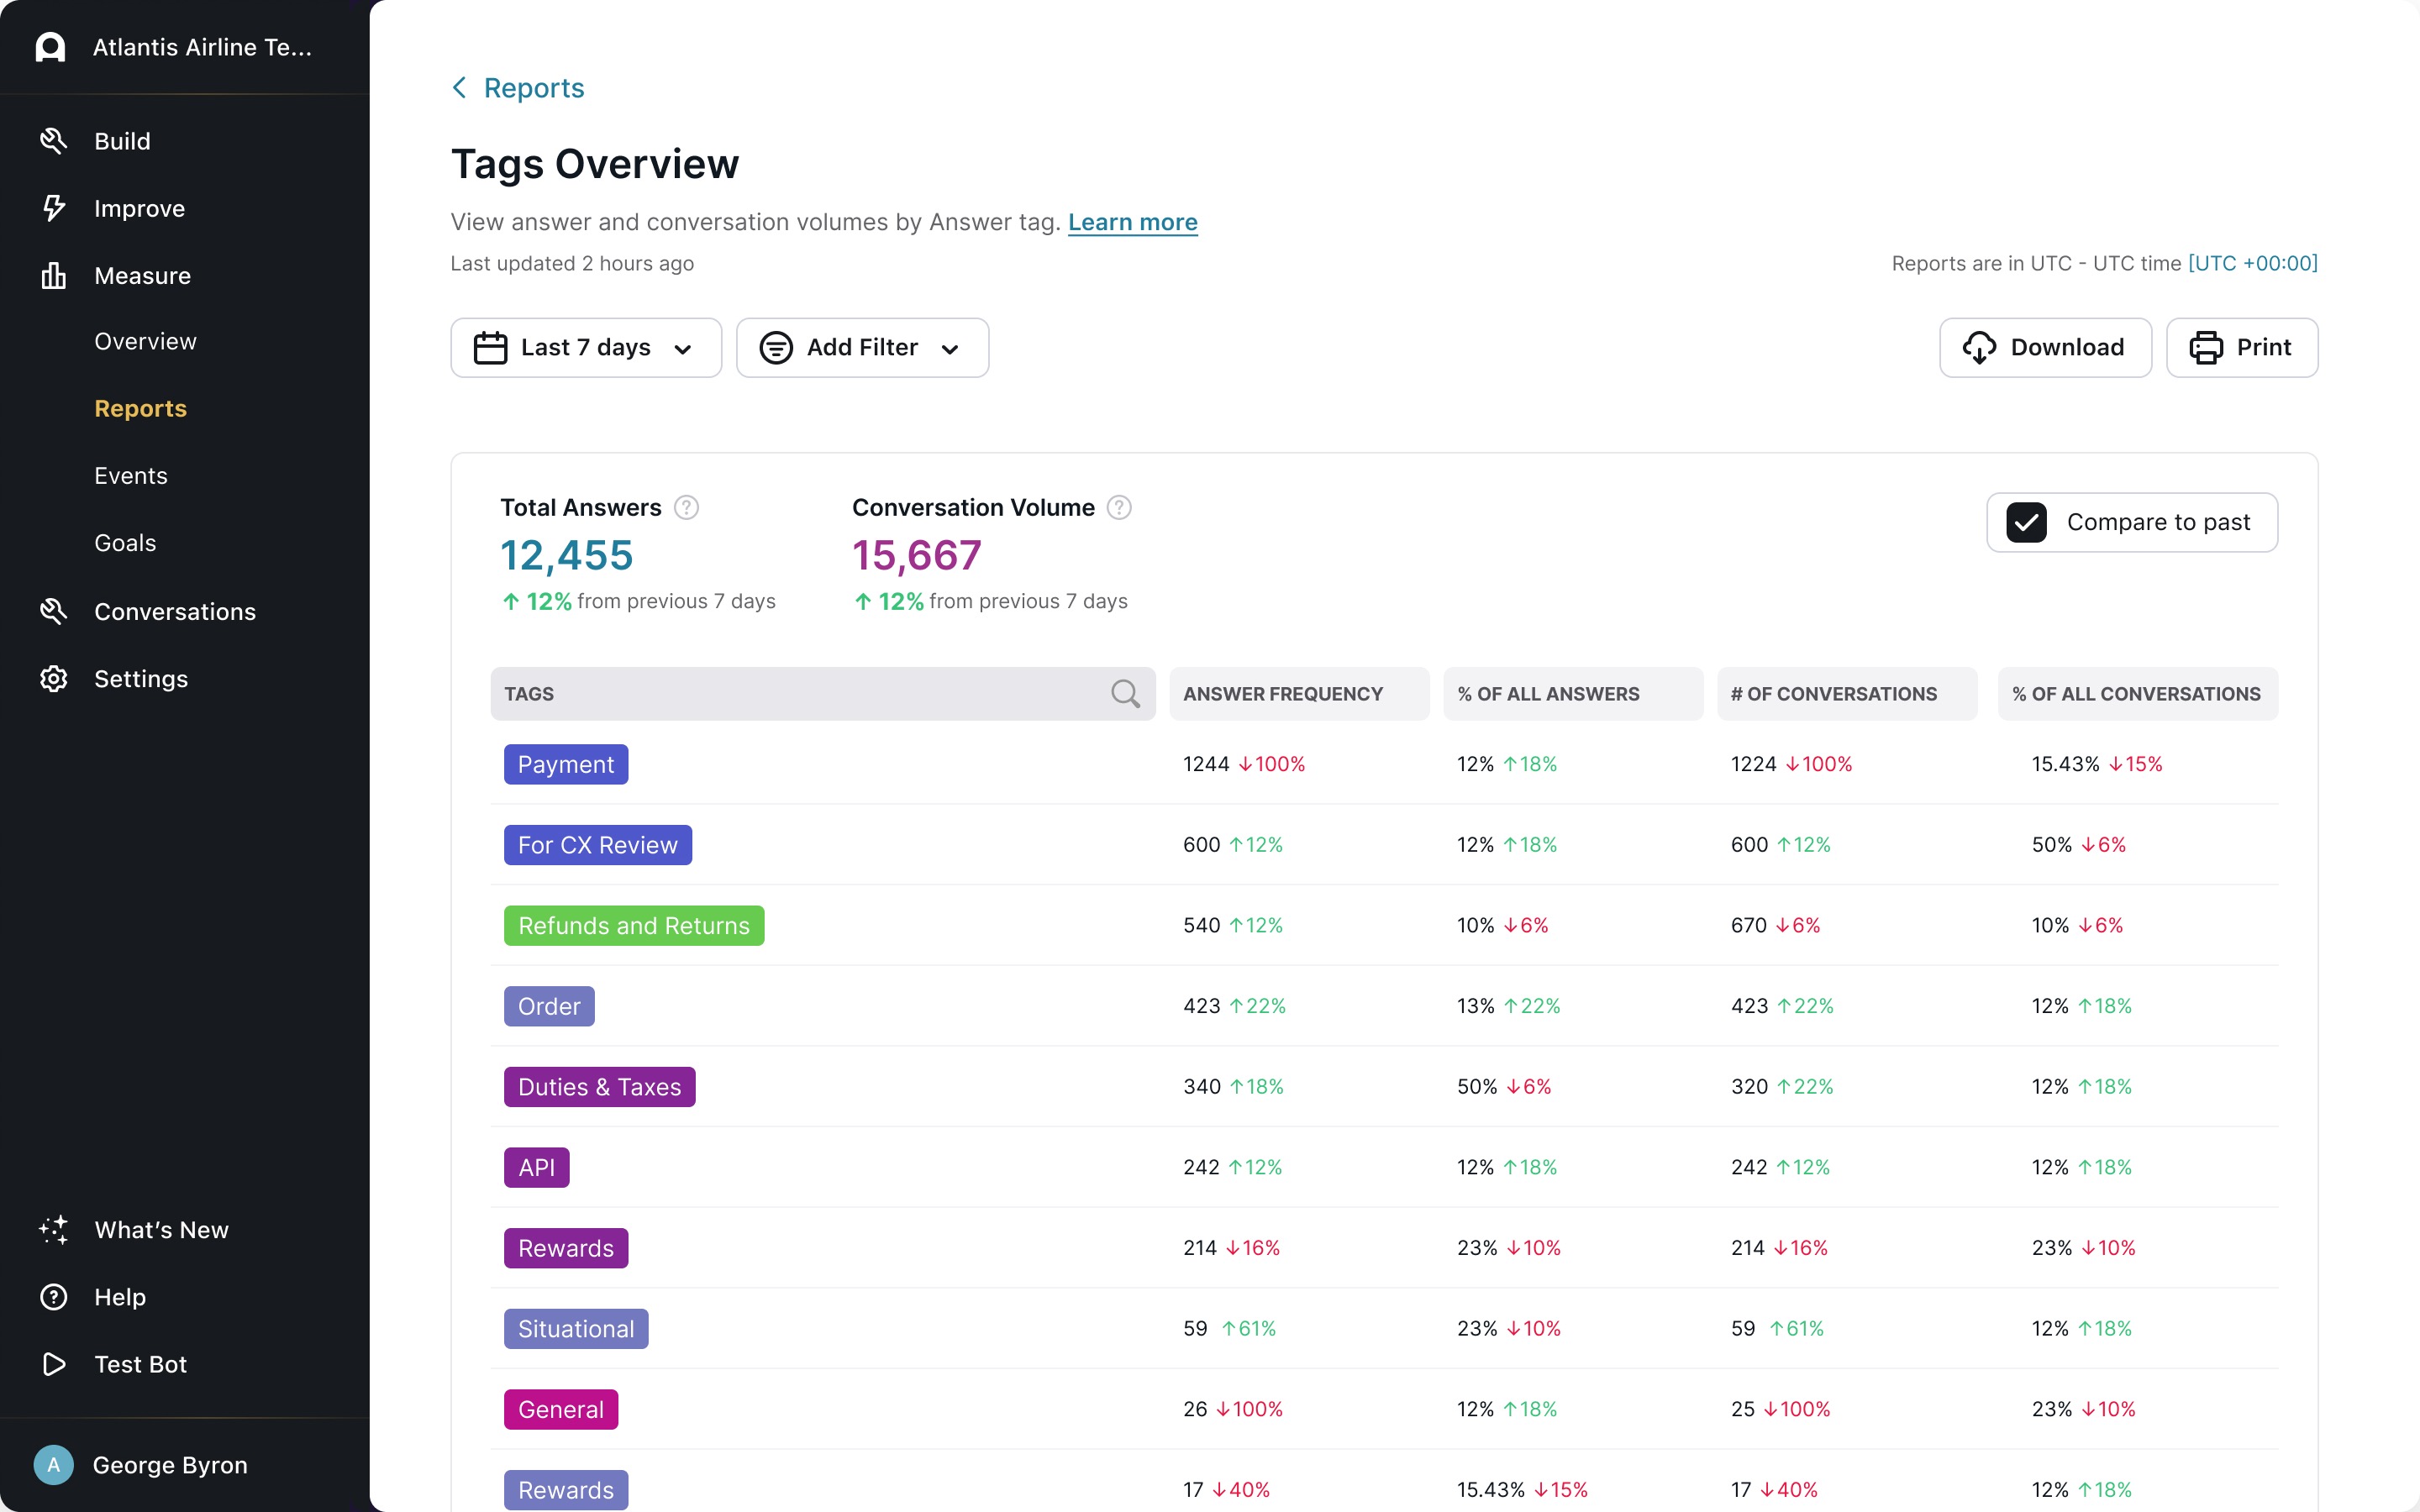
Tags Overview
View answer and conversation volumes by Answer tag. For more information, see Manage content using tags and descriptions.
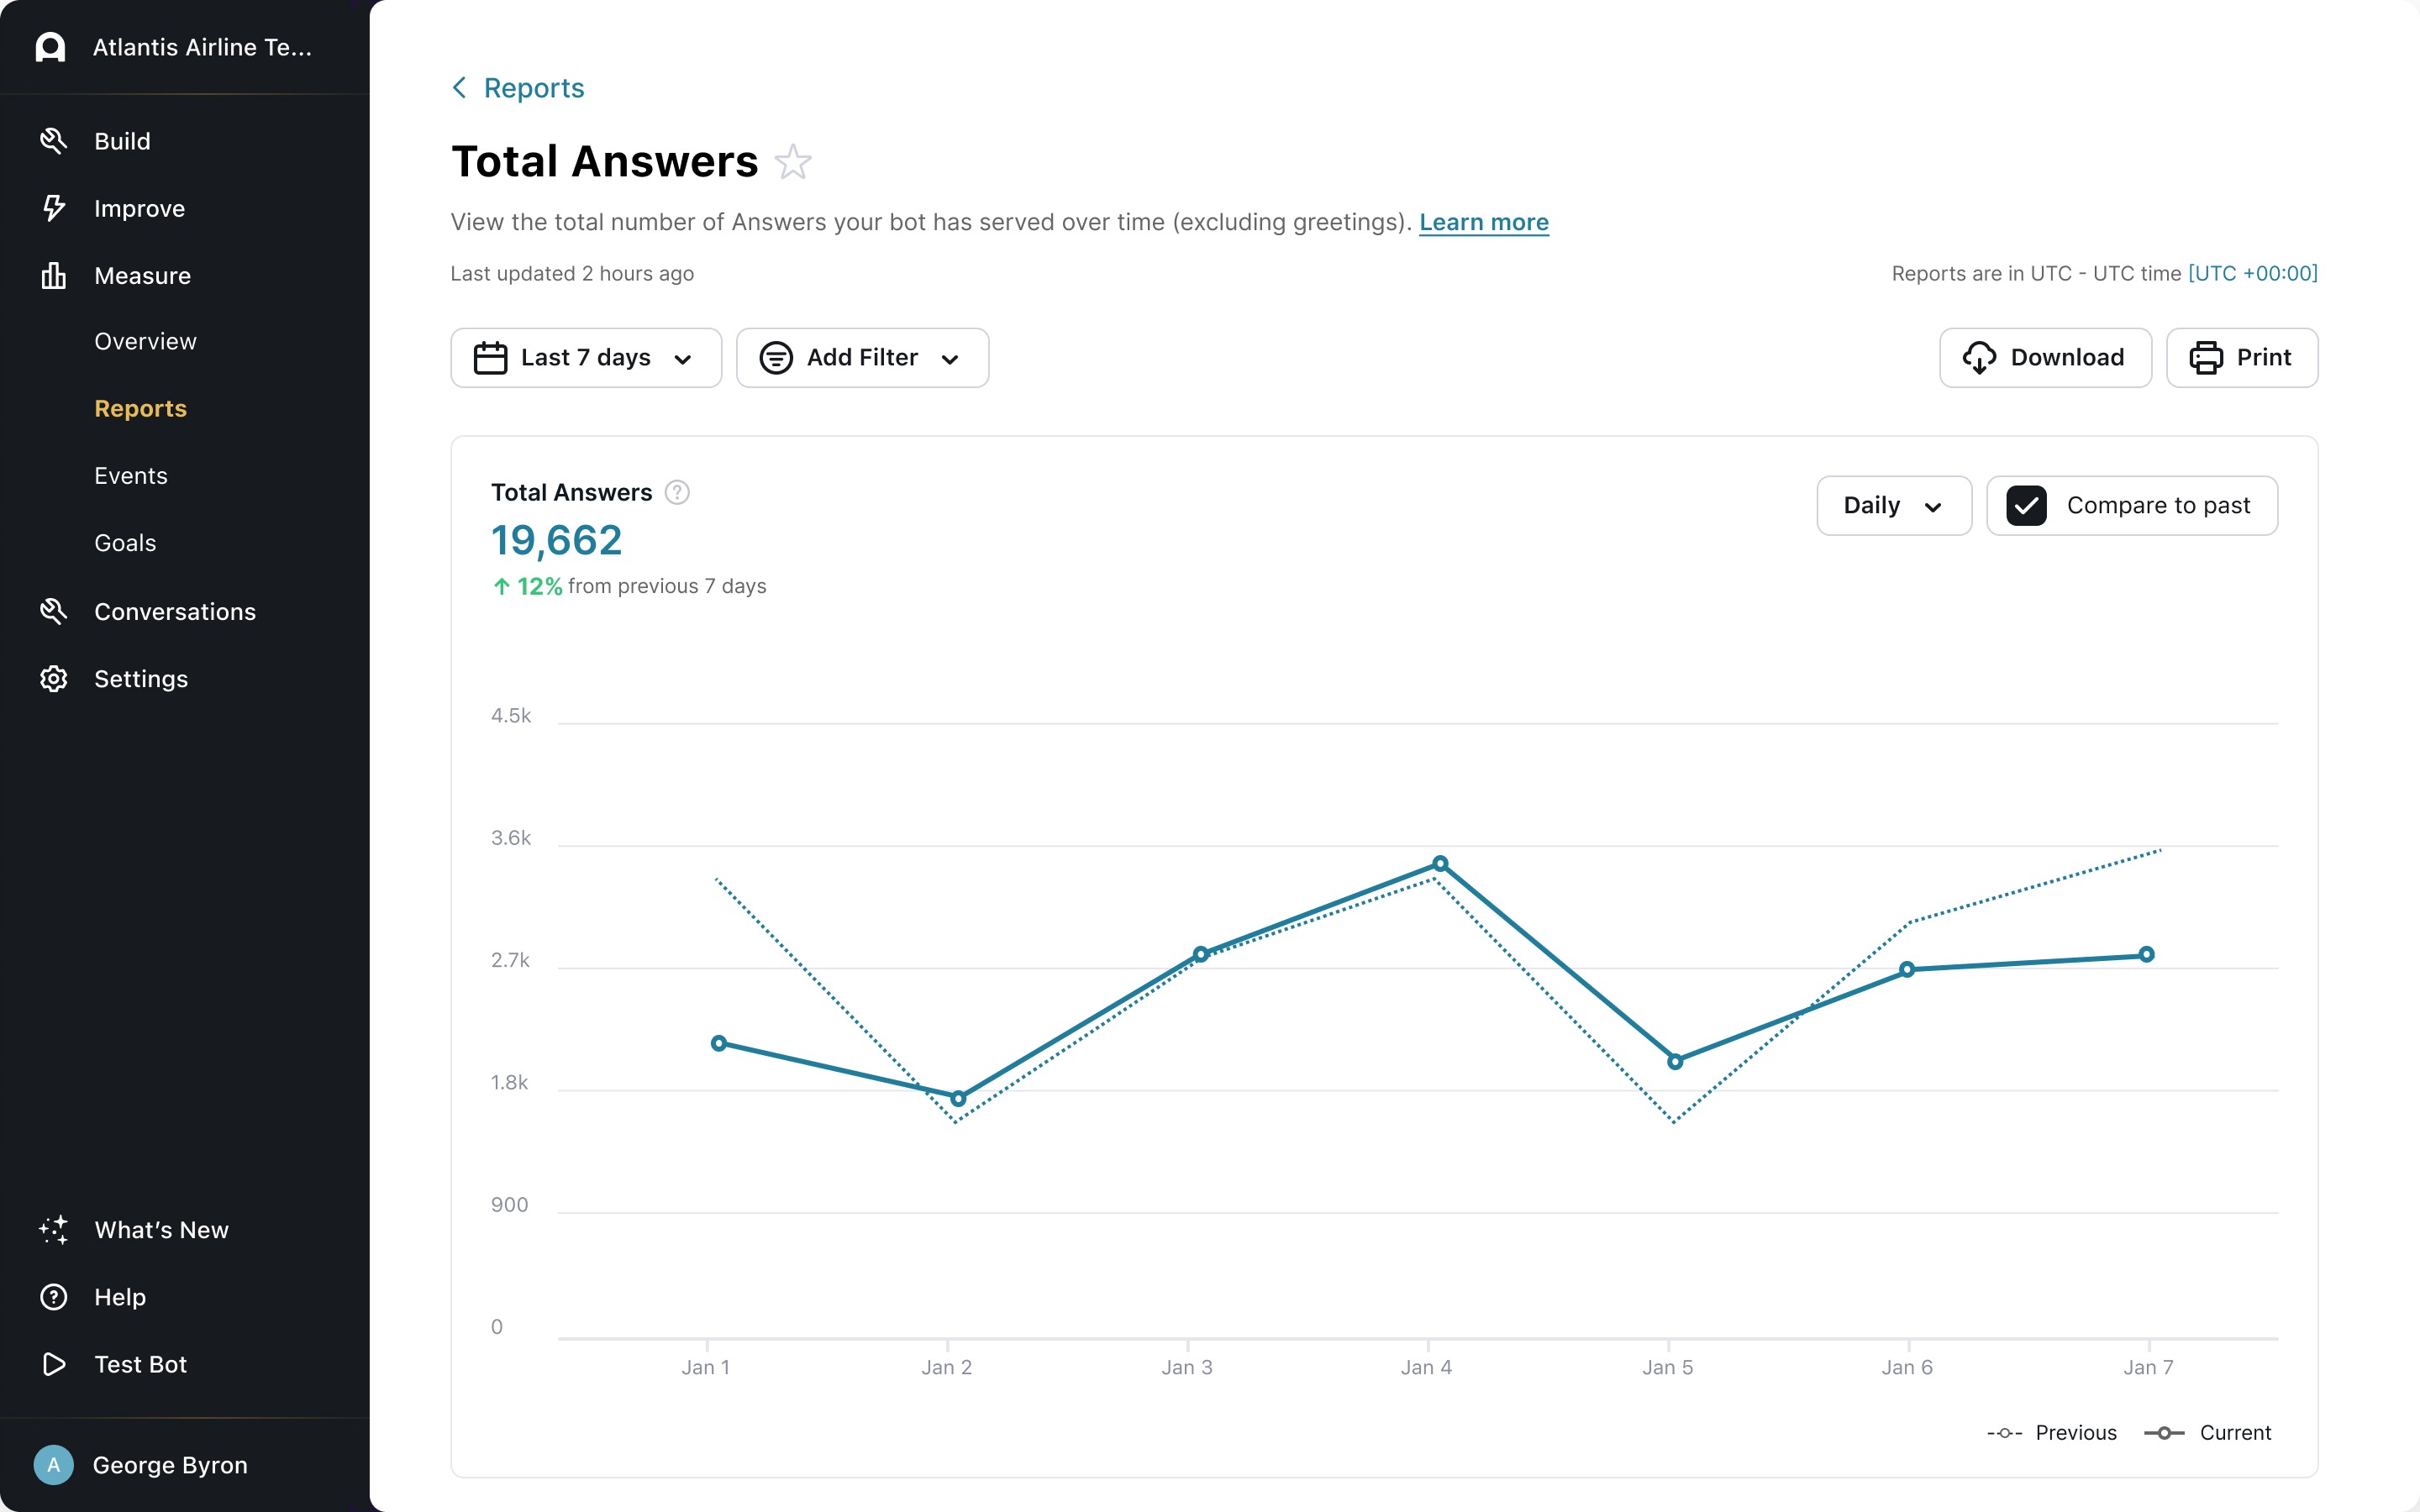
Total Answers
View the total number of Answers your bot has served over time (excluding greetings).
Filter the data that appears in a report
Filter data by date
To filter a report by date:
-
Click the date filter drop-down.
-
Define your date range by one of the following:
-
Select a predefined range from the list on the left.
-
Type the filter start date in the Starting field. Type the filter end date in the Ending field.
-
Click the starting date on the calendar on the left, and the ending date on the calendar on the right.
-
-
Click Apply.
The date filter dropdown provides you with the ability to specify the date range you want to filter the report’s data by. You can select from a list of preset date ranges or select Custom… to specify your own by way of a calendar selector.
Filter data by additional criteria
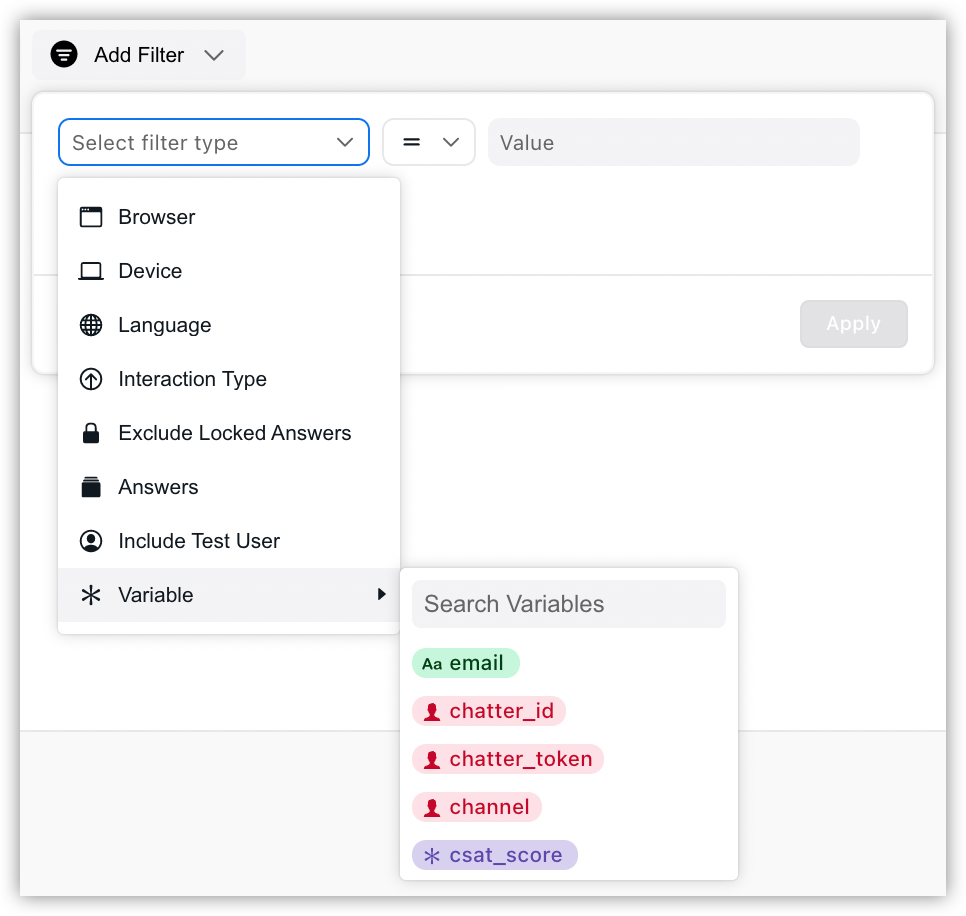
The list of available filters differs for each report, depending on the data the report includes. Clicking the Add Filter drop-down menu gives you access to the filters relevant to the report you’re viewing.
-
Previous Timeframe: Display the immediate past timeframe (same length) to compare against current selection. Graphs will also display a figure representing the delta (difference) between ranges (ie. how much did your bot’s volume rise or drop between timeframes)
-
Exclude Locked Answers: Graphs and tables will only display volumes for answers created after bot creation (for more details on locked answers, see “Answers That Don’t Need Training” here). This will remove volume for answers like “Greeting” and “Not Understood.”
-
Language (if Multilingual feature enabled): Include/exclude volume of different languages if your bot has content in other languages.
-
Platform: Isolate different platforms that your bot is visible in or interacts with (ex. Nuance, Zendesk, SMS, etc)
-
Browser: Isolate users from specific internet browsers (ex. Chrome, Firefox, etc)
-
Device: Isolate users from specific devices and operating systems (ex. Windows, iPhone, Android, etc.)
-
Answers: Isolate specific answer(s). This can be used to check the performance of an answer or multiple answers over time.
-
Interaction Type: Isolate answers that result from questions that were clicked (quick reply buttons) or typed.
-
Include Test User: Include conversations originating from the Ada dashboard test bot. Test bot conversations are excluded by default.
-
Filter by Variable: View only the conversations which include one or more variables. For each variable, you can define specific content the variable must contain, or simply whether the variable Is Set or Is Not Set with any data.
Additional information
-
Report data is updated approximately every hour (but may take up to three hours).
-
Reports are in the time zone set in your profile.
Printing
We recommend viewing your bot’s data in the dashboard for the best experience. However, if you need to save the report as a PDF or print it physically, use the following recommendations to limit rendering issues:
-
Click Print.
-
In the Print window that appears, beside Destination, select either Save as PDF or a printer.
-
Click More settings to display additional print settings.
-
Set Margins to Minimum.
-
Set Scale to Custom, then change the value to 70.
- Alternatively, you can set the Paper size to A3 (11-3/4 x 16-1/2 in) or Legal (8.5 x 14 in).
-
Under Options, select the Background graphics checkbox.
-
Right before saving or printing, scroll through your print preview, and beside Pages, change the number of pages you want to include in your PDF or printout. The settings you changed above may affect how these pages render.
-
If your destination is Save as PDF, click Save. If your destination is a printer, click Print.